Have you ever watched a user perform horribly during a usability test only to watch in amazement as they rate a task as very easy to use? I have, and as long as I’ve been conducting usability tests, I’ve heard of this contradictory behavior from other researchers. Such occurrences have led many to discount the collection of satisfaction data altogether. In fact I’ve often heard that you should watch what users do and not what they say because attitudes are often at odds with their behavior. For example:
- Participants’ answers [to likert questions] are often at odds with their behavior (UPA 2004)
- Objective measures of performance and preference/satisfaction do not often correlate (Mayhew 1999)
- First Rule of Usability: Don’t Listen to Users…pay attention to what users do, not what they say. Self-reported claims are unreliable (Nielsen 2001)
So there appears to be some well formed opinions about the collection of subjective usability data. I wanted to see if I could find a systematic pattern either supporting or refuting the apparent truism that users say and do different things.
The third quote from above “Don’t Listen to Users …” comes from a Nielsen article from 2001. A further look at this article suggests the issue might be a bit more nuanced. In it he reports on a relatively strong correlation (r = 0.44) between users’ measured performance and their stated preference (in reference to Nielsen & Levy 1994). In fact, in an earlier analysis I did with Jim Lewis (Sauro & Lewis, 2009) we found an even stronger correlation of .51 between post-task ratings of usability and completion rates. Post-task ratings of usability are those few questions asked immediately after a task is completed. While they can measure different things, they all tend to correlate highly with each other and attempt to measure something like the perceived ease of use or the overall satisfaction with the task. For brevity, I’ll refer to what they are measuring as satisfaction.
To dig into what a correlation of .51 between completion rates and post-task satisfaction means, I returned to the database from which we did that analysis. It has since grown to contain 123 usability tests representing data from over 3000 users. They are summative usability tests from 30 institutions and are a mix of mostly lab-based (attended) and remote (un-moderated) summative usability tests. In this dataset 53 tests contain some type of post-task usability questionnaire. From these tests there are 677 tasks generating 19,576 observations of users attempting a task and rating their perception of the usability. If users say and do systematically different things then it’s going to show up here.
Almost all questionnaires (94%) use either 5 or 7 point scales and are either a single questions such as “Overall, this task was” (very easy to very difficult) or averages of 2 to 5 questions (see for example the ASQ, Lewis 1993). The remaining questionnaires are the Subjective Mental Effort Questionnaire (aka SMEQ) (4%), some Usability Magnitude Estimation (1%) and some other 3 point scales (1%) See (Sauro & Dumas 2009) for more information.
To analyze the different scale types together, I converted the raw scores into percentages of the maximum score and reversed some scales so they all pointed in the same direction—where higher scores mean higher satisfaction. For example, on a five point scale raw scores of 1,2,3,4 and 5 become 0, 25, 50, 75 and 100%. On a seven point scale they become 0, 16, 33.3, 50, 66.6, 83.3 and 100%. There would be more points in-between for questionnaires that used more than one question.
Failing a Task
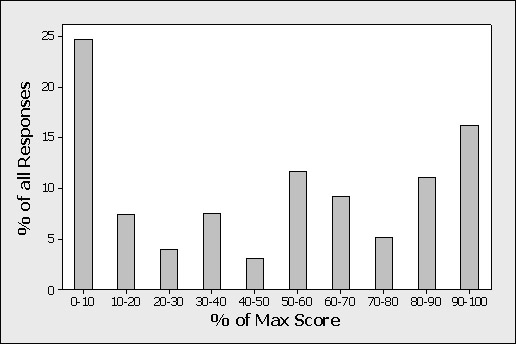
Let’s first look at the users who failed a task and see how they rated it in terms of satisfaction. Of the 19,576 task observations, 5,594 were failures (around 29%). Of these failed tasks, 790 or 14% rated the task the highest possible score in satisfaction (with a 95% Confidence Interval between 13.2 and 15.1%). That would be like rating a task a 5 out 5 after failing. Users are about 6 times more likely to rate satisfaction something less than the maximum score when they fail a task (86%/14%). Figure 1 below shows the distribution of responses when users fail as a percent of maximum scores.
When we lower the ratings to 90% of the maximum score, 16% rated at or above this point. (95% CI between 15.2 and 17.2%). The combination of 90% is only possible from questionnaires with at least two questions or scales (e.g. a rating of a 4 and a rating of a 5 gets you 4.5 which is 90% of 5) or from the single question, 150 point SMEQ.
When we lower the threshold to 80% of the maximum score we get 27.3% of users rating it at this point or higher. (95% CI: 26.1 to 28.4%). A rating of 6 out of 7 would fall in this range. Lowering the threshold again to 70% shows that 32.5% of users (95% CI: 31.3 to 33.7%) who fail a task rate it at this point or higher. This would include users who rate 4 out of 5 (75% of the maximum score).
If we look at just 7 point scales (53% of all scales), given a task failure, the probability of a rating of the maximum satisfaction score of 7 is 18%. The probability of a 1—the minimum score—is 24%.
If we look at just 5 point scales (42% of all scales), again given task failure, the probability of a rating of the maximum satisfaction score of 5 is 9%. The probability of the minimum satisfaction score of 1 is 17%.

Figure 1: Distribution of responses when users fail a task. % of Max score is used so different point scales can be combined (e.g. 5 and 7). For example, a raw rating of 6 on a 7 point scale is a % Max Score of 85.7.
Passing a Task
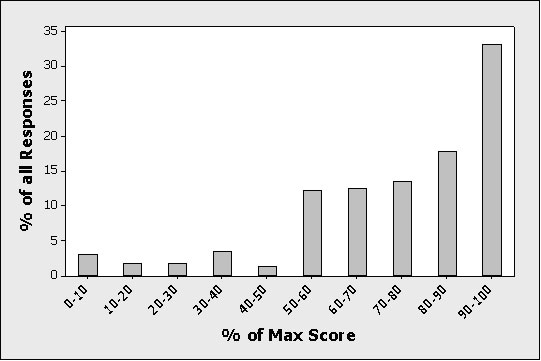
As a point of comparison, Figure 2 shows scores from users who successfully completed (“passed”) the task. Twenty-seven percent rated it as the maximum score (95% CI: 26.3 to 27.8%), 33% rated it at 90% of the maximum score or above (95% CI: 32.3 to 33.8%) and 51% rated it at or above 80% of the maximum score (95% CI: 50 to 51.6%). Only 2.8% of users (2.5 to 3.0%) who passed a task rated it at 0% of the maximum score (e.g. a 1 out of 7 or 1 out of 5).
Figure 2: Distribution of responses when users pass a task. % of Max score is used so different point scales can be combined (e.g. 5 and 7). A raw rating of 6 on a 7 point scale is a % Max Score of 85.7.
Rating an Extreme Score
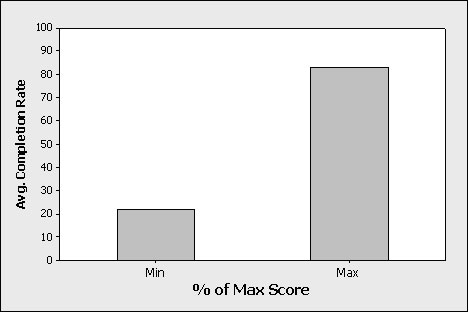
We looked at what people rate when they pass or fail a task, but we can also look at satisfaction data from the opposite perspective—what percent pass or fail given a certain rating. When an item gets rated at its maximum or minimum, it appears a better indication of the task’s outcome (pass or fail). In fact, 82.7% of users who rated at 100% satisfaction also successfully completed the task (95% CI: 81.6% to 83.8%). Conversely, users who rated the lowest satisfaction scores completed 22% of tasks (95% CI: 20% to 24.2%). In other words, it’s an 80/20 rule of satisfaction and completion. Approximately 80% of users who rate at the maximum level of satisfaction will pass and 20% fail the task. Approximately 80% of users who rate at the minimum satisfaction level will fail the task and 20% will pass it. Users are 4 times as likely to complete a task when they rate it at the maximum satisfaction versus the minimum satisfaction score.

Figure 3: Average completion rates when users rate the minimum satisfaction score and maximum satisfaction score. Users are 4 times as likely to complete a task when they rate it at the maximum satisfaction versus the minimum satisfaction score.
Conclusion
So do users who fail a task still rate it as easy? If we restrict “easy” to only mean the maximum level of satisfaction, then about 14% of users do. If we more loosely define easy as anything above 75% of the maximum score (3.75 out of 5 and 4.9 out of 7), then this happens about 1/3 of the time.
I’m inclined to think that it’s those extreme responses that garner all the attention. There are likely a number of reasons for the less than perfect correlation between task success and satisfaction rating. One major factor is that users aren’t always aware they “failed” a task, and so, thinking they successfully completed it, give it a high rating. The noticeable task failures lead to low satisfaction ratings most of the time. The 80/20 rule tells us that extreme measures are a decent indication of task outcomes. I’m also inclined to think that rating tasks in the extreme after poor task performance are such salient events that it contributes to an Availability Heuristic. We researchers are generally interested in improving ease of use, so we tend to focus more on task failures. We also tend to remember those 5’s much more than all those 3’s and 4’s. In other words, we remember the task failures and we really remember the task failures which elicit favorable satisfaction scores. But in general the extreme satisfaction responses tend to be informative. Users are about 6 times more likely to rate satisfaction something less than the maximum score when they fail a task. They are also 4 times more likely to complete a task when they rate it the maximum satisfaction versus the minimum satisfaction score.
References
- Nielsen (2001) “First Rule of Usability? Don’t Listen to Users” http://www.useit.com/alertbox/20010805.html
- UPA Idea Market 2004
- Mayhew, Deborah, “The Usability Engineering Lifecycle” 1999 p 129
- Lewis, J. R. (1991). Psychometric evaluation of an after scenario questionnaire for computer usability. studies: The ASQ. SIGCHI Bulletin, 23, 1, 78-81.
- Nielsen, J. and Levy, J. (1994). Measuring usability: preference vs. performance. Commun. ACM 37, 4 (Apr. 1994), 66-75.
- Sauro, J. & Dumas J. (2009) “Comparison of Three One-Question, Post-Task Usability Questionnaires.” in Proceedings of the Conference in Human Factors in Computing Systems (CHI 2009) Boston, MA.
- Sauro, J., & Lewis, J. R. (2009) “Correlations among Prototypical Usability Metrics:Evidence for the Construct of Usability” in Proceedings of the Conference in Human Factors in Computing Systems (CHI 2009) Boston, MA.


