 Ranking questions are a popular way to understand how respondents in UX research prioritize items such as product features, habits, purchases, color schemes, or designs.
Forcing participants to make tradeoffs on what’s most important versus least important helps avoid the “everything is important” problem you get when you ask respondents to simply rate how important each thing is on a rating scale (they could give everything the same rating).
While there is clear value to the researcher in having a prioritized list, there can be a cost to the participant. The larger the list, the larger the cognitive burden. While it’s straightforward and easy to rank four or five items, it gets a lot more demanding when you have to rate 10, 20, or even 30+ items.
It would be good for research planning if we could predict how long these ranking questions take and how difficult participants find the task of ranking. While we know that the time and perceived difficulty are likely context-dependent (how complex the items are and how strong of an opinion people have), we wanted to see whether we could uncover patterns in ranking behavior and attitude. For example, is there a simple linear increase in effort and time, or is there a more non-linear (e.g., quadratic) increase that levels off? How many items are too many to rank?
Knowing how long and how difficult ranking questions are can help researchers better plan surveys, potentially reducing fatigue, which leads to study dropout. We needed data.
Study Details
To understand how difficult and time-consuming ranking questions were, we set up a series of studies using the drag-and-drop ranking feature in MUiQ®. Between January and March 2023, we conducted four surveys in which we included ranking questions with varying numbers of ranking items and content. Participants ranked four item sets: two were on website activities, and two were of everyday objects.
Set 1: Activities on a home improvement website (for example):
- Shopping for tools or hardware
- Looking for project materials
- Shopping for lumber or composites
Set 2: Activities on a wireless phone carrier website (for example):
- Checking what my bill is
- Browsing plans
- Browsing for a phone
- Looking for deals/bundles
Set 3: Foods (fruits and vegetables, for example):
- Watermelon
- Apple
- Orange
- Eggplant
Set 4: Animals (domestic and wild, for example):
- Dog
- Cat
- Snake
- Sheep
In total, there were 24 different ranking questions. One was presented at the beginning of the survey, and one was presented at the end. Participants were asked to complete two rankings, but they never ranked the same number or type of items. For example, one participant might be asked to rank 22 foods at the beginning of the survey and then 24 animals at the end, while another participant might rank five wireless activities at the beginning and then 16 home improvement activities at the end. Across the surveys, we balanced as best we could the number of items and contents at the beginning and end of the surveys to reduce order effects.
Ranking questions were placed alone on a survey page so the time spent ranking could be isolated (Figure 1).
After each ranking question, participants used the SEQ® to rate how difficult it was to do the ranking.
Study Results
We received data from 541 participants across the four surveys from a U.S.-based online panel company. The correlation between the time to rank and perceived ease was strong (r = −.63). We analyzed both the time to rank and perceived ease.
Time to Rank
The mean time to complete the ranking questions was 76 seconds (minimum of 20 and maximum of 172 seconds). The time to complete, as expected, was a function of the number of items the participants had to rank.
We ran a simple linear regression and noticed a strong positive relationship between the number of items and the time to rank (Figure 2). The number of items explained an impressive 83% of the variance in time.
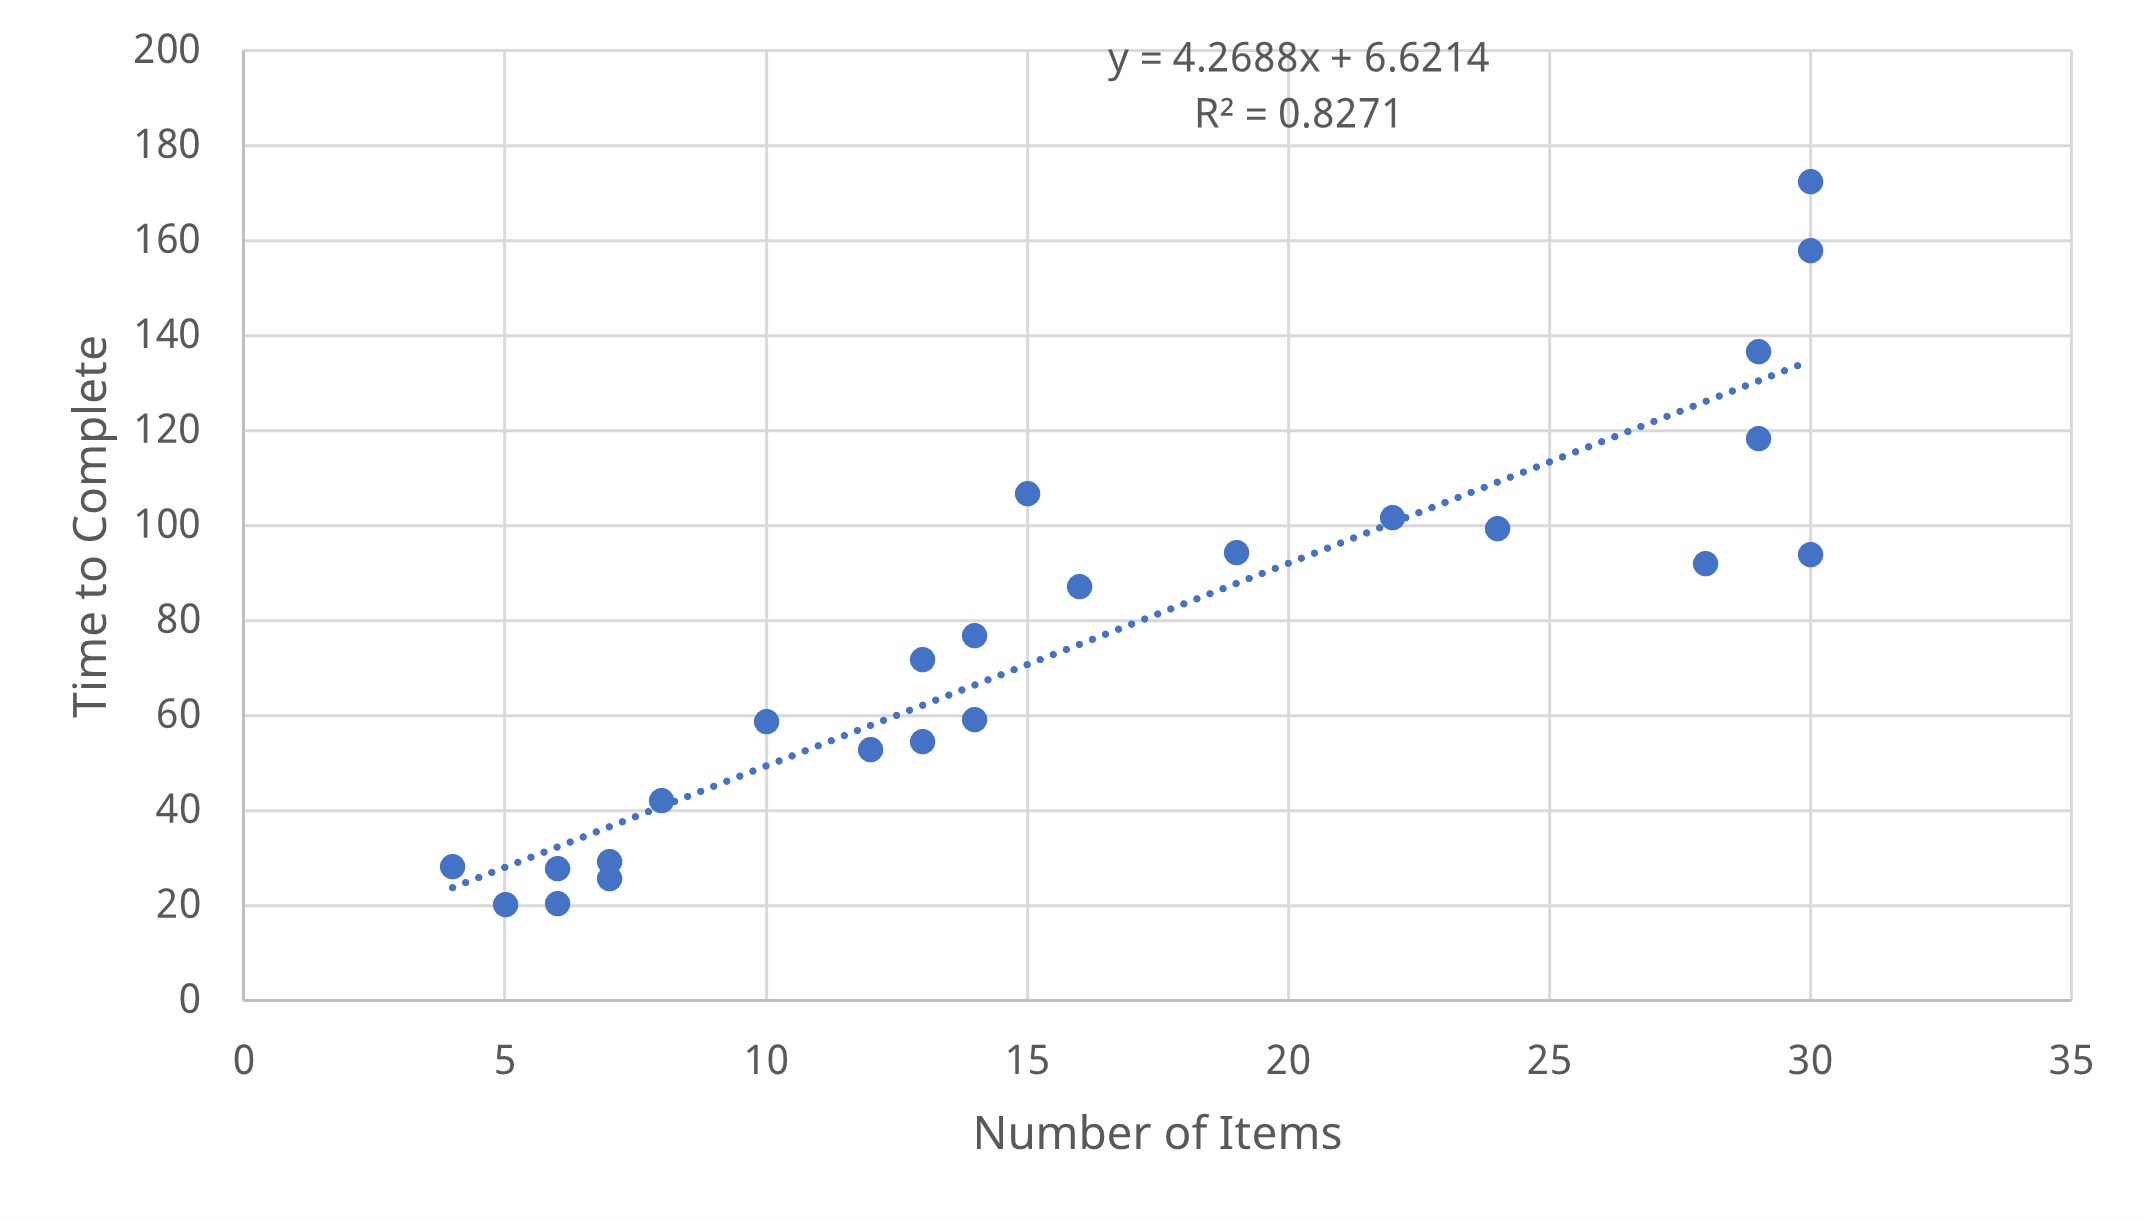
We did notice more variation in the times when there were around 30 items. Why would it take more than 50% longer to rank the same number of items? We suspected that one reason was a learning effect, or possibly a combination of learning and fatigue, so participants made faster decisions the second time.
In all our surveys, respondents ranked two sets of items (one at the beginning and one at the end of the survey), with each survey taking 5 to 13 minutes to complete. We added the additional variable of presentation order (first or second) to the regression equation and found it was a statistically significant predictor. The number of items and order together explained over 87% of the variance (Time = 36.9 + 4.26(Number of Items) − 20.1(Order)).

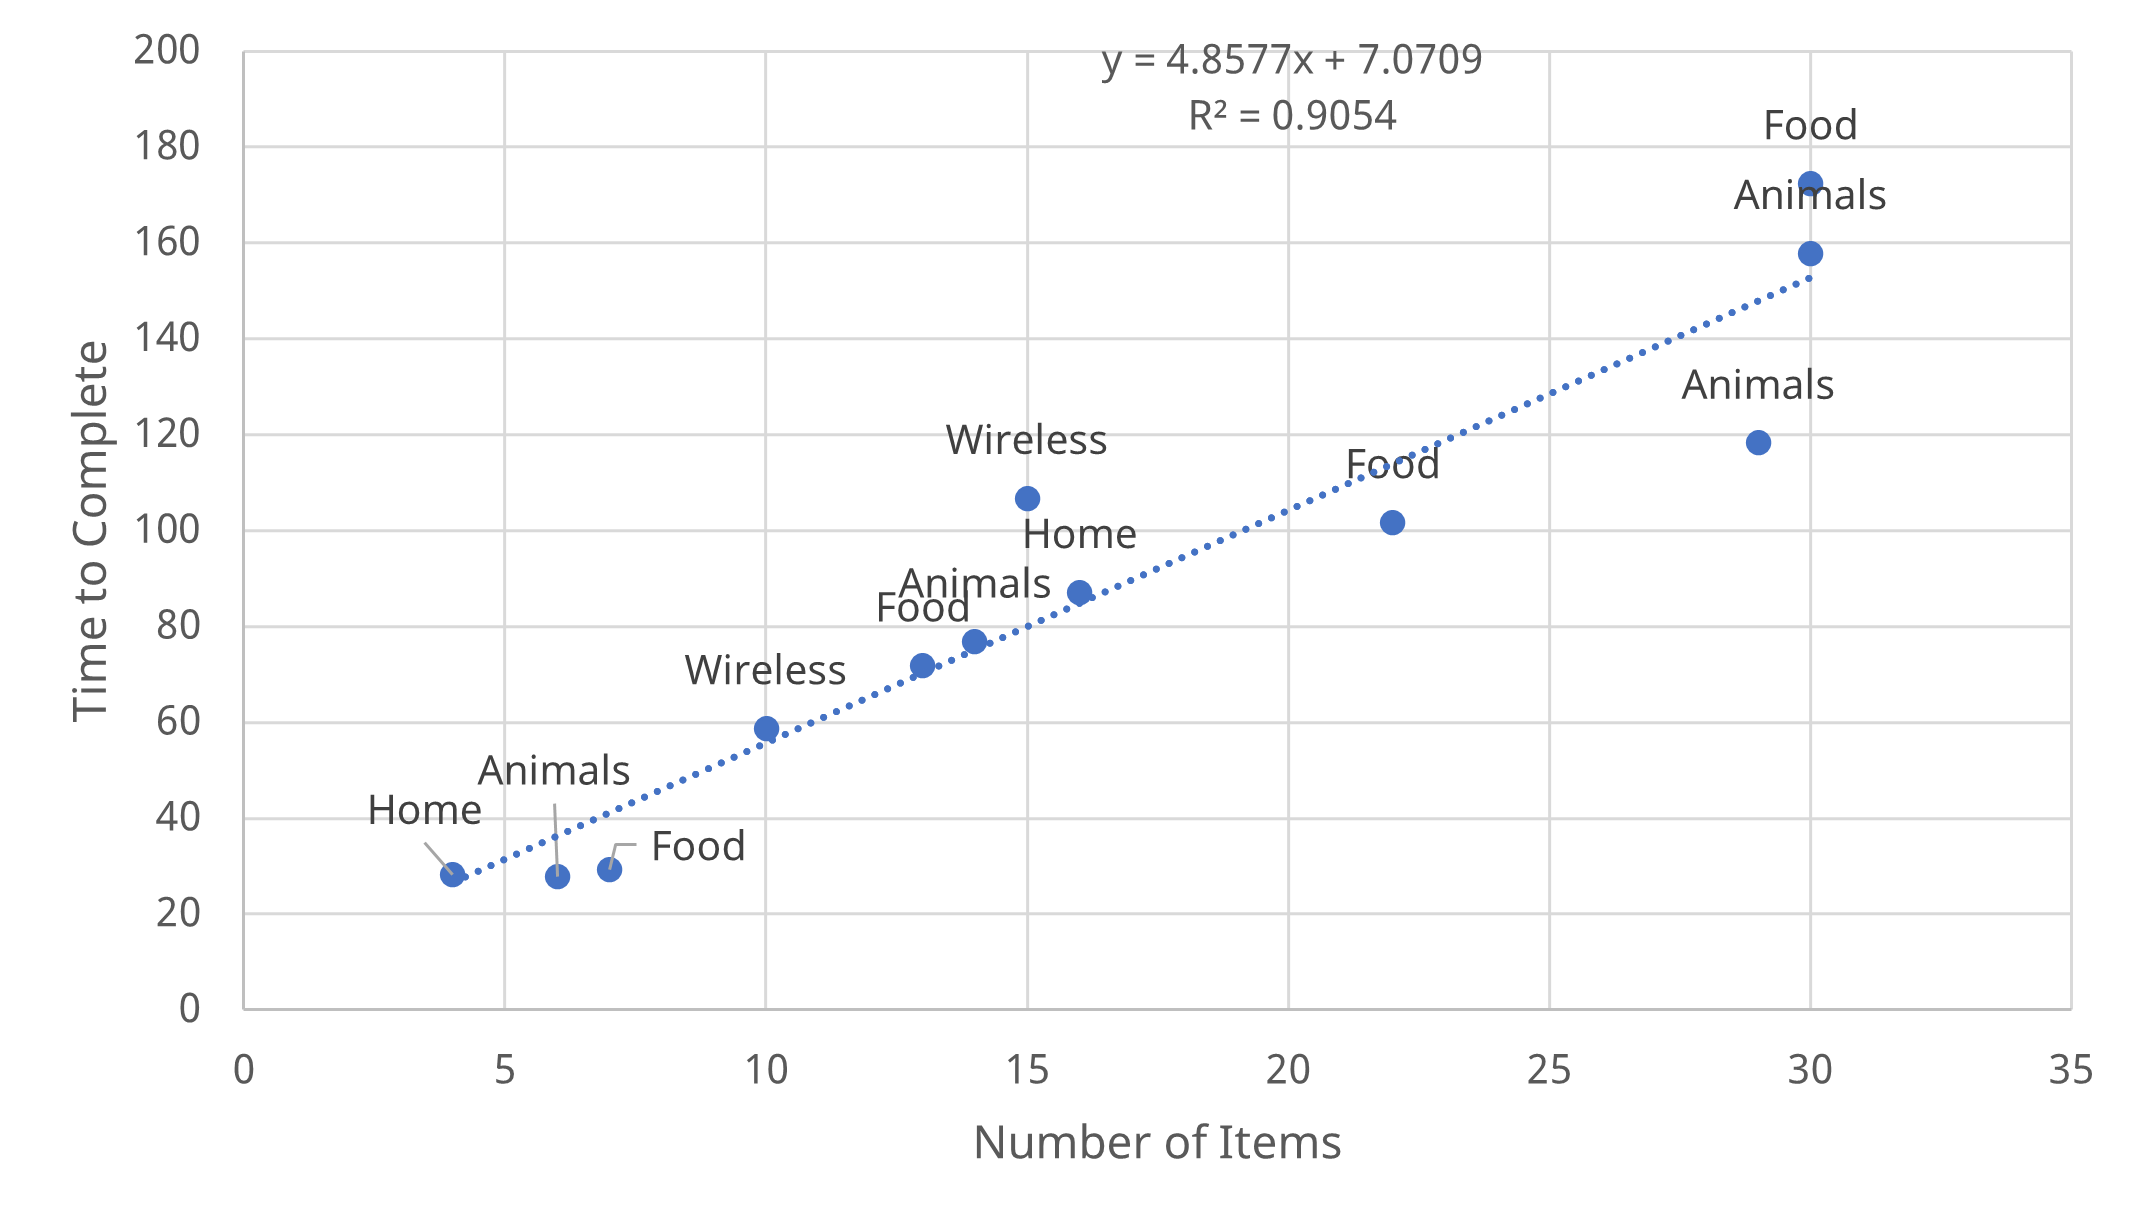
The regression equation suggests that the second time people encounter a ranking question in a survey, their completion times are on average 20 seconds faster than their first encounter with a ranking question. We re-ran the regression equation using only the first ranking question from each survey. This reduced the number of questions in the analysis to 12 but improved the fit. Figure 3 shows that a simple linear equation does a good job of explaining time to rank with an R2 of 91%. To use the equation to estimate the time to rank, start with 7 seconds and add about 5 seconds per item. For example, if you have ten items, it will take almost a minute to complete.
Ease of Ranking
We also conducted an analysis with the Single Ease Question (SEQ) as the dependent variable and the number of items as the independent variable in a simple regression. Figure 4 shows the expected negative relationship between items and ease (more items are rated harder to rank) for all the ranking questions. The relationship of the number of items with perceived ease isn’t as strong as it was with time, but it was still significant, accounting for about 37% of the variation in SEQ.

Figure 5 shows the negative linear relationship between the SEQ and the number of items for the first ranking question in a survey. Similar to time, there was a better fitting line, with the R2 increasing to 49% (accounting for about half the variation in SEQ). Interestingly, Food was consistently above the regression line while Home and Wireless were consistently below, suggesting that it was easiest to rank Foods.
A benefit of the SEQ is that we have a historical “average” difficulty (about 5.5) derived from task-based usability studies across hundreds of websites and products. Figure 5 shows that, indeed, ranking around 30 items is harder than average. However, participants also rated Wireless and Home Improvement sets with 10–15 items as harder than average (and about as hard as ranking double or triple as many animals). This suggests it’s as much what’s being ranked as the quantity being ranked that affects the perceived burden. This makes it unclear how many is too many.

Summary and Discussion
Our analysis of 24 ranking questions from 541 participants revealed:
The number of items to be ranked significantly predicts the time to rank. The more items in a ranking question, the longer it takes to rank. This linear relationship is very strong, especially when modeling only the first ranking question in a survey (R2 = 91%).
Each item adds about five seconds to the time to complete the first ranking question in a survey. The regression model for the first ranking question in a survey indicates that a good estimate of the time to rank is a baseline of seven seconds plus five seconds for each item. We studied ranking questions that had from four to thirty items, so we can’t extrapolate this finding much beyond thirty items.
Ranking was faster the second time. On average, the time to complete the second ranking question was about 40 seconds faster than the first ranking question (almost twice as fast). This could be due partially to learning (participants were familiar with the mechanics of ranking in MUiQ) and partially to fatigue (participants being less inclined to carefully consider the items being ranked so they could complete the survey faster).
The number of items to be ranked significantly predicts the perceived ease of ranking. The more items in a ranking question, the more difficult it feels to rank. Focusing on the first ranking question in a survey, the number of items accounts for almost half of the variation in SEQ ratings (R2 = 49%). When including first and second ranking questions in the model, the fit is lower but still significant (R2 = 37%).
The number of items matters, but the content also plays a role in the perceived ease of rating and determining how many is too many to rank. There wasn’t much variation in the types of items being ranked in this study, but there was some. For example, an examination of the points in the scatter plot in Figure 5 shows that the mean SEQ ratings for Food are above the regression line (easier to rank), and the ratings for Home and Wireless are below the line (harder to rank). The SEQ ratings imply that ranking 10–15 Wireless or Home Improvement items is harder than average and about as hard as ranking two to three times as many animals, suggesting that common rules of thumb (e.g., avoid asking people to rank many more than ten items) will not always be accurate. Researchers can’t determine how many is too many to rank by just counting items. They also need to consider the respondents’ familiarity with and the conceptual closeness of the concepts.