 Banking isn’t limited by borders.
No matter what language you speak, there’s a universal need to save and access money, check balances, transfer money, and pay people. What’s also universal with digital banking is the inevitable friction caused by security concerns and troublesome user interfaces.
While our previous SUPR-Q® benchmark reports have focused on U.S. banks, this study broadens the scope to evaluate how international banking websites and apps perform across multiple regions.
To understand the quality of this online experience, we used MUiQ to collect UX benchmark metrics on nine popular international banking websites and mobile apps in 2025:
- ANZ Banking
- BNP Paribas
- Commonwealth Bank (Australia)
- HSBC
- ING Bank
- Itaú Unibanco
- National Australia Bank
- Royal Bank of Canada
- Westpac
We computed SUPR-Q® and Net Promoter scores, investigated reasons for using the websites, measured users’ attitudes regarding their experiences, conducted key driver analyses, and analyzed reported usability problems. (Full details are in the downloadable report.)
Benchmark Study Details
In May 2025, we asked 462 users of international banking websites to recall their most recent experience and perceptions of one of the international banking websites on their desktop and mobile app (if applicable) in the past year.
Respondents completed the eight-item SUPR-Q (which includes the Net Promoter Score), the two-item UX-Lite®, and the SUPR-Qm standardized questionnaires, and they answered questions about their brand attitudes, usage, and prior experiences.
Participants in the study came from eight (non-U.S.) countries, reflecting the areas serviced by the international banks. Most participants in the sample were from Australia (34%), the UK (26%), Canada (17%), and Brazil (6%).
Quality of the Website User Experience: SUPR-Q
The SUPR-Q is a standardized questionnaire widely used for measuring attitudes toward the quality of a website user experience. Its norms are computed from a rolling database of around 200 websites across dozens of industries.
SUPR-Q scores are percentile ranks that tell you how a website’s experience ranks relative to the other websites in the database (50th percentile is average). The SUPR-Q provides an overall score as well as detailed scores for the subdimensions of Usability, Trust, Appearance, and Loyalty.
The mean SUPR-Q across international banking websites in this study was at the 61st percentile. However, there was substantial variation between the sites. Itaú Unibanco had the highest SUPR-Q score (96th percentile), followed by Westpac (73rd percentile), while BNP Paribas had the lowest SUPR-Q score (26th percentile).
Usability Scores
Overall, usability scores were around average for the international banking websites, with a mean at the 55th percentile. Consistent with the overall SUPR-Q, Itaú Unibanco had the highest usability score (at the 79th percentile), and BNP Paribas had the lowest usability score (16th percentile). Respondents mentioned frequent issues with website loading times and difficulty finding information due to the amount of cluttered information on the website.
Comments related to usability on BNP Paribas included:
“The website can be kind of laggy and clunky at times, especially when using the search bar.”
“The website is overloaded with different features and options.”
Although BNP Paribas received the lowest usability ratings, they were not alone in the issues users reported experiencing. Around 21% of ANZ users and 26% of HSBC users had similar trouble finding information on those websites due to the overwhelming amount of content, taking significant time and effort to sift through it all.
Loyalty/Net Promoter Scores
Most of the international banking websites had positive Net Promoter Scores. The exceptions were BNP Paribas, HSBC, and National Australia Bank. The average NPS for the international banking websites was 9% (slightly more promoters than detractors), which is below the average of 19% for the Net Promoter Scores in our 3Q/2025 SUPR-Q database. Itaú Unibanco was most likely to be recommended with an NPS of 58%, and BNP Paribas was least likely to be recommended with an NPS of −18%.
Unsurprisingly, respondents reported being most likely to continue using Itaú Unibanco and least likely to continue using BNP Paribas (Figure 1).

Figure 1: Likelihood to continue using the websites (90% confidence intervals).
Comments related to the NPS and loyalty included:
“It is very complete, I have accounts at other banks and the details and information available at Itaú are considerably better than those of competitors; for example, it is easy to identify and understand some important features.” — Itaú Unibanco
“I have been a customer with the bank for quite a while. I have encountered some glitches which can be frustrating but overall … my needs were met.” — National Australia Bank
“Honestly, I visit because we opened a home loan here. I wish every day we didn’t. As soon as it’s been a year, we will move. The app and website are nearly impossible to use—they look good, but the actual use is such a headache, especially compared with my previous banks (ING/Macquarie.) Things are slow, the website doesn’t work on my usual browser (Opera), and nothing is clear. How much interest am I saving by having an offset? Unclear. They don’t tell me.” — Westpac
“It’s only an account I use because I need to. There are so many better and easier to use bank[s] for accounts that work for 99% of people 99% of the time. With better customer service, size of operation, outreach, benefits, etc. — BNP Paribas
Websites and Mobile App Usage
As a part of this benchmark, we asked respondents how they accessed the international banking websites. All respondents reported using their desktop/laptop computers (this was a requirement for participation in the survey), with 94% also using mobile apps and 65% also using mobile websites.
Users most frequently reported visiting international banking websites on a desktop or laptop computer a few times per month or a few times per year. Interestingly, users reported using the mobile app more frequently, reporting that they visited the mobile app from daily to a few times a week.
Comments about the international banking companies related to mobile app usage included:
“It’s practical and easy to use, and its performance is very good. I had a much older phone, and the bank app ran smoothly.” — Itaú Unibanco
“I like how easy it is to find information. I also like that you can activate your card and book appointments.” — Royal Bank of Canada
“I like how easy it is to manage my account, make transfers, and check transactions in just a few seconds, no matter where I am.” — BNP Paribas
“Sometimes the app freezes or asks me to log in again for no clear reason, which can be frustrating, especially when I’m in a hurry.” — BNP Paribas
Key Drivers of UX Quality
To better understand what affects SUPR-Q and Likelihood-to-Recommend (LTR) ratings, we asked respondents to rate potentially important attributes of the international banking websites on a five-point scale from 1 (Strongly disagree) to 5 (Strongly agree). We conducted key driver analyses (regression modeling) to quantify the extent to which ratings on these items drive (account for) variation in overall SUPR-Q and, separately, LTR (the rating from which the NPS is derived; full details are in the downloadable report).
Twelve significant key drivers accounted for 66% of the variation in SUPR-Q scores. The top key driver of the international banking website experience was “I can compare rates and fees easily” (accounting for 11% of SUPR-Q variation). Other significant key drivers included “It’s easy to update my personal information” (8%) and “It’s easy to make a payment or transfer” (6%).
We used the same set of predictors to model variation in LTR ratings, with eight significant drivers accounting for 43% of its variation. As in the SUPR-Q analysis, the top key driver in this LTR analysis was “I can compare rates and fees easily” (9%). Three other predictors each accounted for 6% of variability, including: “My finances are in safe hands with [international banking website],” “It’s easy to update my personal information,” and “It’s easy to manage my investment portfolio.”
Figure 2 shows a scatterplot of importance and opportunity for improvement for twelve key drivers (the twelve that most significantly influenced the variation of SUPR-Q and LTR scores). The combination of importance and opportunity for improvement provides a basis for prioritizing which key drivers to improve. The importance score is the average of the variance accounted for by the driver in the SUPR-Q and NPS analyses, where larger percentages indicate more importance. The opportunity score is the top-box percentage for the driver, so smaller percentages indicate greater opportunity for improvement (e.g., it would be harder to improve a driver with a top-box percentage of 90% than one with a top-box percentage of 10%).

Figure 2: Scatterplot of importance and opportunity for improvement of key drivers.
Three key drivers fell in the upper-left quadrant with relatively high importance and greater opportunity for improvement (especially ease of comparing rates and fees, which had a top-box percentage of just 21% overall, ranging from 13% for BNP Paribas to 33% for Commonwealth Bank).
UX Problems
We examined respondents’ verbatim comments to better understand the user experience problems.
The major theme was the difficulty of finding information/cluttered websites, which was the primary complaint for five of the nine banks (ANZ Banking, Commonwealth Bank, HSBC, Royal Bank of Canada, Westpac).
Top themes for the other four banks were slow loading times (BNP Paribas, Itaú Unibanco), unlikable UI designs (ING Bank), and poor customer support (National Australia Bank).
Major Theme: Difficulty Finding Information
This was the primary complaint for five of the banks, but respondents reported difficulty finding online information for all the other banks as well.
Comments about the difficulty of finding information included:
“Sometimes it feels like there are too many clicks to get to the information I need.” — National Australia Bank
“I am not a fan of the overly long graphics that force you to scroll down to find information.” — BNP Paribas (see Figure 3)
“It can be difficult to navigate. I usually resort to using the search bar function.” — Commonwealth Bank
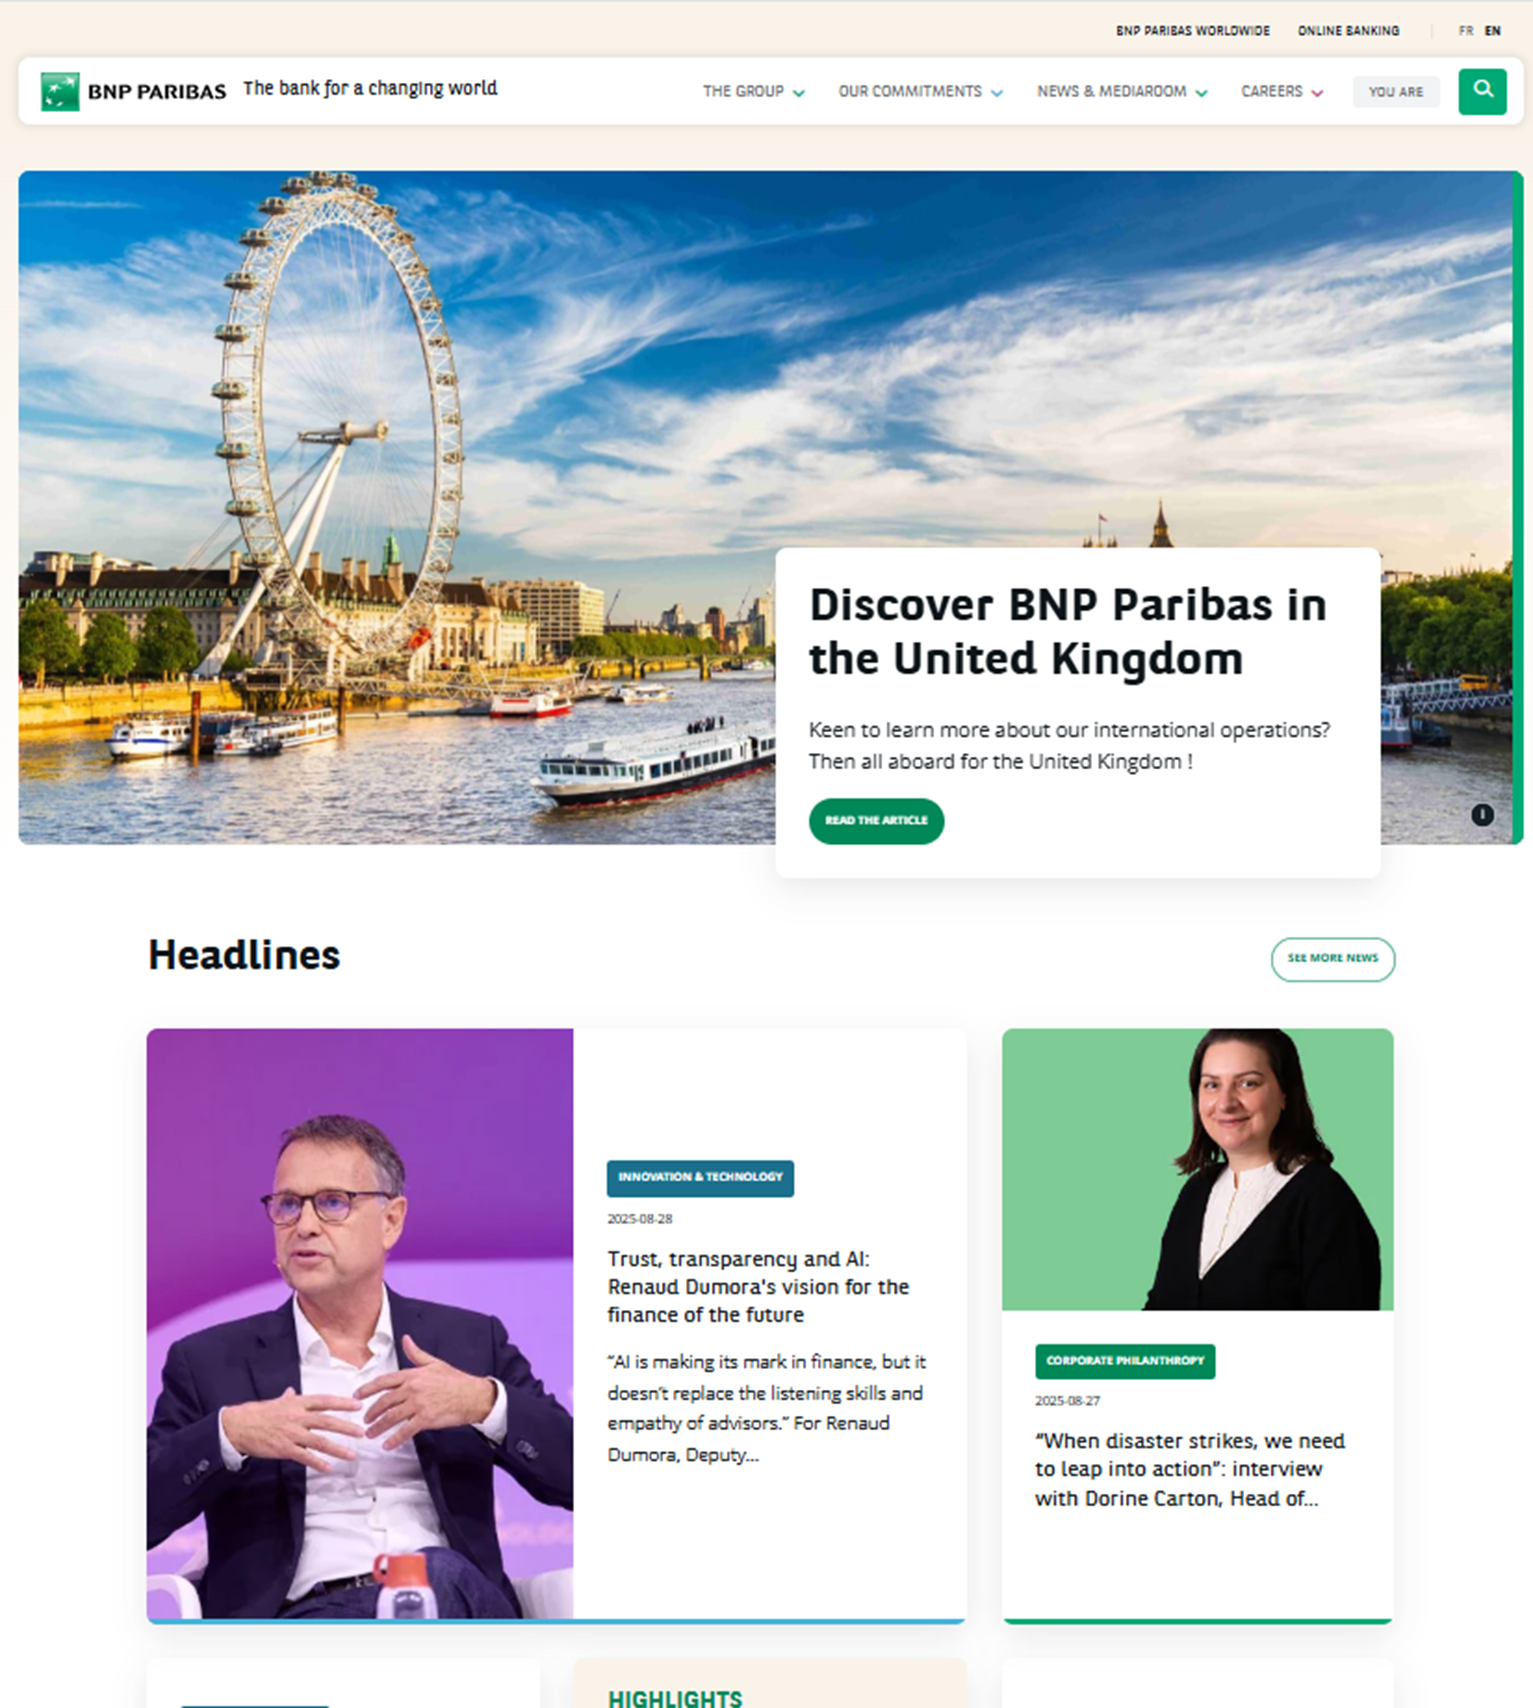
Figure 3: Example of large graphics above the fold on the BNP Paribas home page. Unless this is exactly what users are looking for (and this seems unlikely), they will need to scroll down to search for their desired information (either the content or a link).
Other Top Problem Themes
The remaining top UX problem themes were slow loading times, poor UI design, and poor customer support.
Slow Loading Times
Slow loading times were the most frequent complaint for BNP Paribas and Itaú Unibanco. User comments included:
“Sometimes the site is slow when loading certain pages.” — BNP Paribas
“Sometimes the site is slow to load.” — Itaú Unibanco
Poor UI Design
The most frequent complaint about ING Bank was poor UI design:
“There’s SO much to read and the colours are jarring.” (See Figure 4)
“It feels old-fashioned and clunky at times.”
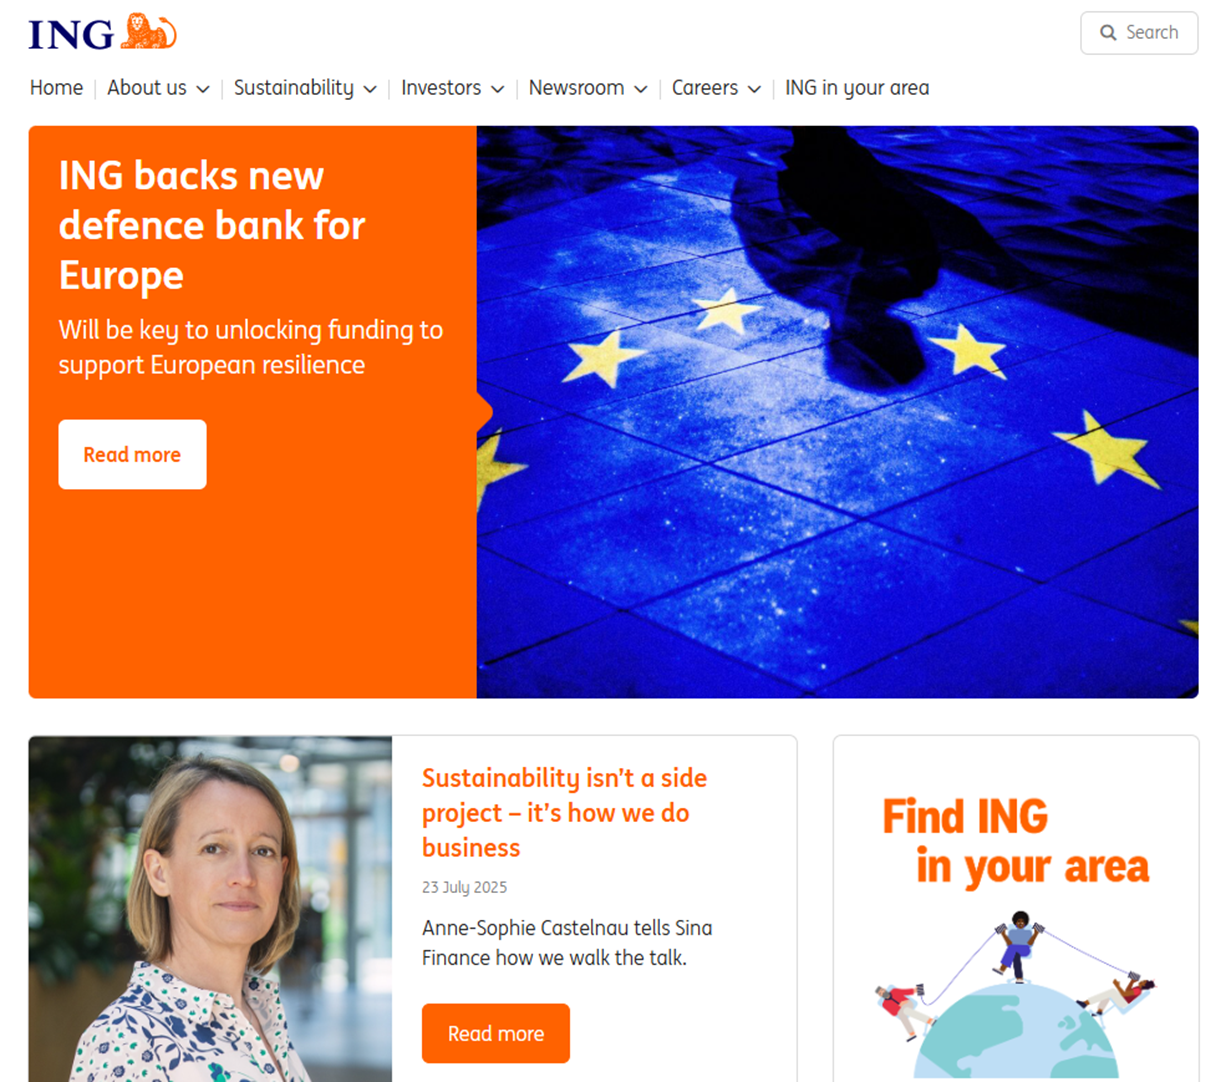
Figure 4: The ING Bank home page, illustrating jarring colors.
Poor Customer Support
For National Australia Bank, the most frequent complaint was poor customer support, especially the chatbot (Figure 5):
“Dislike their chatbot as it does not answer questions specific to my situation and wastes my time. It is also too difficult to get past and be able to speak to a human.”
“Not being able to type in a simple word as the chatbot doesn’t understand me.”
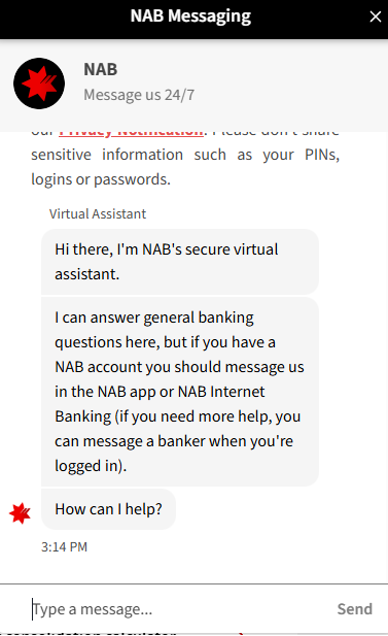
Figure 5: The start of a dialogue with the National Australia Bank chatbot.
International UX Similar to U.S. Banks
Compared to our 2024 U.S. banking benchmark, the 2025 international cohort scored higher on overall UX (61st vs. 49th percentile SUPR-Q scores) and loyalty (avg NPS +9% vs. −17%). Both groups struggle with clutter and findability, but the main levers differ. Internationally, the biggest driver is being able to compare rates and fees (also a top loyalty driver), whereas in the U.S., the strongest drivers were clutter and ease of managing credit/debit cards (with brand attitude weighing heavily on loyalty). International participants also reported higher app adoption (94% vs. 79%). In short, international banks are ahead on the overall experience but can unlock more gains by improving rates/fees comparability, while U.S. banks should focus on decluttering and card/fraud flows.
Summary and Takeaways
An analysis of the user experience of nine international banking websites found:
- International banks vary significantly in their user experiences. While the international banking websites in this study collectively had above-average SUPR-Q scores (61st percentile), Itaú Unibanco had a very high score (96th percentile) while BNP Paribas was well below average (26th percentile). These websites were also the most and least likely to be recommended (Itaú Unibanco NPS: 58%; BNP Paribas NPS: −18%). The international scores were similar in variability and slightly higher than those of the U.S. banks.
- Ease of comparing rates and fees drives UX scores. Our key driver models accounted for 66% of the variation in SUPR-Q scores and 43% of the variation in LTR ratings. The top key driver of the international banking website experience was “I can compare rates and fees easily” (accounting for 11% of SUPR-Q variation and 9% of LTR variation).
- There is an industry-wide opportunity to improve the ease of comparing rates and fees. As described above, this was a significant key driver across international banking websites but had an overall top-box score of just 21%. Our modeling suggests international banking websites could improve their user experience by increasing the ease of comparing rates and fees.
- The top UX problem reported by users was the difficulty of finding information. This was an issue for all nine websites (the top issue for five websites). Other top themes reported for various websites were slow loading times for BNP Paribas and Itaú Unibanco, poor UI design for ING Bank, and poor customer support for National Australia Bank.
For more details, see the downloadable report.