 We typically recommend small sample sizes (5–10) for conducting iterative usability testing meant to find and fix problems (formative evaluations).
For benchmark or comparative studies, where the focus is on detecting differences or estimating population parameters (summative evaluations), we recommend using larger sample sizes (20–100+).
Usability testing can be used to uncover problems and assess the experience. Many usability tests will play both roles simultaneously, formative and summative, so the sample size ends up being a balance to meet the needs of both.
We recently conducted a usability test for a client. It was the second round of prototype testing for a consumer-facing product. The goals were similar to many multi-stage usability tests that balance both formative and summative goals:
- Did the changes made to fix the problems found in the first round improve the experience?
- Did the fixes introduce new problems?
- Is the product good enough for the next stage of development?
This was an executive-sponsored project, and the results would have a high impact on the release schedule. We recommended a fairly large sample size of 18 to increase our confidence in the findings. As is typical for our studies, we then included core metrics to help inform decisions with data in our moderated study.
Our research team described and counted the frequency and severity of the usability issues uncovered, and we collected task completion rates and administered the Single Ease Question (SEQ) to gauge task ease.
After the study, we reported the results, which included a problem list with screenshots, quotes, and a summary of the task- and study-level metrics.
The executive summary suggested that things did improve with the prototype, as we found that participants had a generally good experience with fewer problems uncovered and higher task metrics, although there were still areas for improvement. An executive wanted to know how much faith he should have in the results given a sample size of 18. The number of problems detected and the precision of the metrics communicated for us the effectiveness of the study.
Confidence in Problems Found and Undiscovered
We uncovered few new problems in this round, and they weren’t serious. And the problems found in the first round were mostly resolved after the product team made some fixes. How many more problems are out there that we haven’t detected? What if we tested with another 10 or 20 or 50 participants? UX researchers have faced these questions for decades, and of course, the answers come with some controversy. We think this is mostly because of people misunderstanding some key points. What isn’t controversial is the core idea that you will uncover most of the common issues in the first few participants. Less common problems have a smaller chance of being observed in a usability test with few participants.
How we define “common” is context dependent (we don’t want a lot of problems in an airplane cockpit!). But we can still assign numbers to the words “common” and “less common” for a general user experience that can be modified based on context.
Common problems would be those that affect a reasonably large percentage of users. Surely, these would be problems that affect half (50%) of the participants, but we’d argue that problems affecting as few as a third (33%) of the participants should be considered common. If one out of every two or three users encounters the same problem, it’s a common thing to observe.
Figure 1 shows the cumulative binomial probability of seeing a problem at least once in a usability test given different thresholds of occurrence for a sample size of 18 and, to compare, for a sample size of 5.
If a problem exists and affects 33% or 50% of users, what are the chances we saw it in this usability test? At a sample size of 18, the answer is greater than 99% for both definitions of “common.”
At a sample size of 5 the answer is still an impressive 97% and 87%, so not much difference. Both offer high confidence in finding common problems.
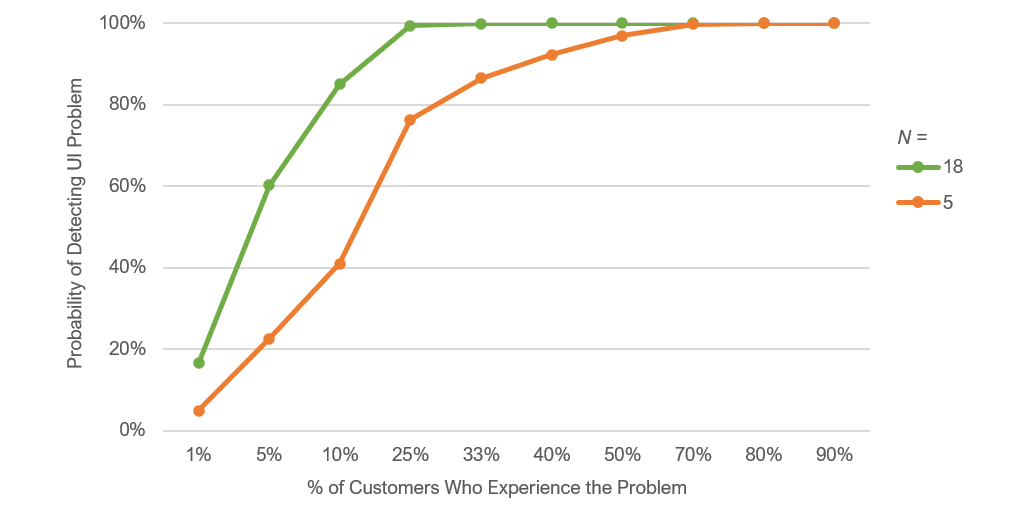
Figure 1: Probability of seeing an issue at least once for 5 and 18 users based on how common the possible problem would be in the customer base.
For less common problems, we can assign numbers of 10% (1 out of every 10 users) and 5% (1 out of every 20 users). Looking at Figure 1, we see that a sample of 18 has, respectively, an 85% and 61% chance of detecting problems of those frequencies at least once (find the green points above the 5% and 10% on the horizontal axis).
In contrast, the smaller sample size of 5 would have respective chances of only 41% and 23% of detecting those issues (find the points on the blue line above the 5% and 10% points on the horizontal axis). The difference shows the benefit of having a larger sample size of 18: you have higher confidence that you’ve seen both common and uncommon (but possibly still critical) problems.
Task Completion Was Above Average
Turning to the metrics for task completion rate, we see in Figure 2 that completion rates varied between 78% and 95% for the five tasks. The bar graph includes 90% confidence intervals; we can use the low end of the interval line to have some idea about the lower bound of the completion rate if we were to test dozens or hundreds more participants. What is an acceptable task completion rate? Again, this is context-dependent, and some of the considerations in this context are that the product certainly doesn’t involve life and death consequences and is still in its early stages of development.
But in any context, higher is, of course, better. We’ve found from measuring over a thousand tasks that a 78% completion rate (the average for all those tasks) is acceptable in most contexts. We’ve used that data to put together a rough curved grading scale for task completions, shown in Table 1. Because 15% of the tasks in our reference group had completion rates of 100%, it’s not possible to discriminate pluses or minuses at the A level. By design, the mean of 78% is in the center of the range for a C grade. The lowest completion rate to score a C is 67.3.
| Grade | Percentile Range | Success (%) |
|---|---|---|
| A+ | 96-100 | 100 |
| A | 90-95 | 100 |
| A- | 85-89 | 100 |
| B+ | 80-84 | 96.9-99.9 |
| B | 70-79 | 90.3-96.8 |
| B- | 65-69 | 86.7-90.2 |
| C+ | 60-64 | 83.1-86.6 |
| C | 41-59 | 67.3-83.0 |
| C- | 35-40 | 61.4-67.2 |
| D | 15-34 | 33.6-61.3 |
| F | 0-33.5 | 0-33.5 |
Table 1: Curved grading scale for task completion rates.
Figure 2 shows that the lower bound of the 90% confidence interval doesn’t dip below C for all tasks except for Task 2, which falls into the D range. So, there’s reasonably high confidence that most users can complete most tasks. Effectiveness, however, is only one aspect of the user experience; it’s necessary but not sufficient.
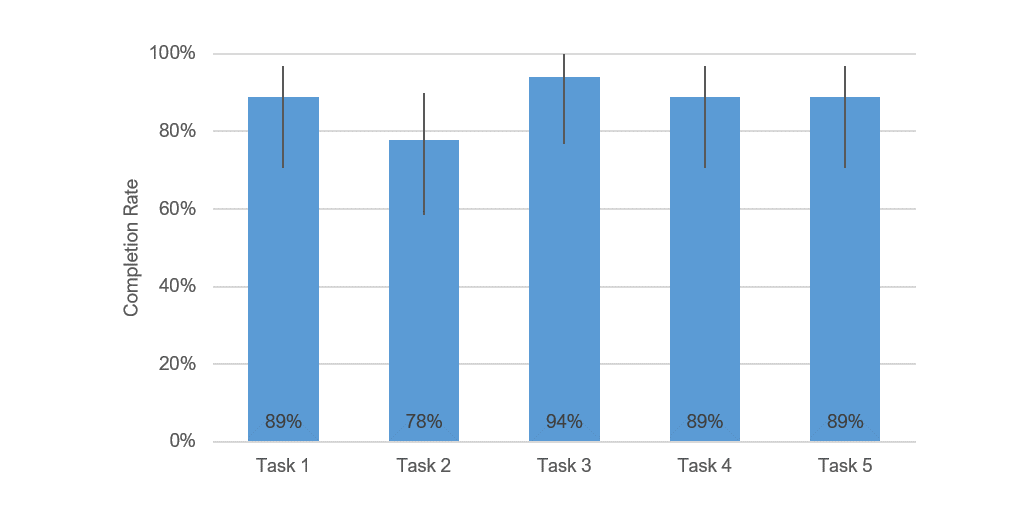
Figure 2: Task completion rate for the five tasks evaluated.
Task Ease Was at Best Average
Turning to the perception of the experience, Figure 3 shows the mean SEQ scores for each task and a line at the average historical ease of about 5.5. We can see from Figure 3 that the lower limit of the 90% confidence intervals for three tasks exceeded the average historical ease, but for two it did not. It’s especially interesting that although Task 1 had a high completion rate (89%), it had the lowest ease rating, meaning users could complete the task, but they didn’t think it was that easy. For the rest of the tasks, successful completion and ease were consistent. (Without Task 1, the correlation between completion and ease was .98; with Task 1, it dropped to .62.)
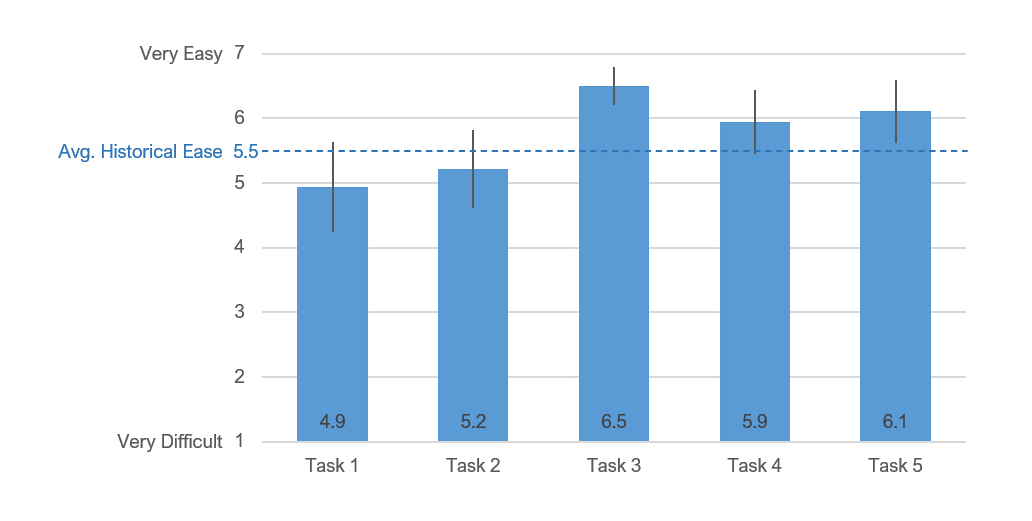
Figure 3: Ratings of task ease (SEQ) for the five tasks evaluated.
Summary
Most usability tests mix formative and summative goals, both finding problems and gauging performance, so there is often a need to balance the sample size requirements for each purpose. To assess the confidence in finding problems, use the cumulative binomial probability formula to assess how many common and uncommon problems you’ve likely seen (and how many remain undiscovered). It’s easy to see common problems with a small sample size, but you’ll need a larger sample size to detect uncommon issues.
To assess performance, use task metrics such as completion rate and perceived ease. Both of these measures work well on both prototypes and fully functioning products and can be compared to historical benchmarks or conventions.
In this case study, with a sample size of 18, we had high confidence that we saw most of the common issues and many of the less common ones. Task metrics showed most users could complete most tasks, and with one exception, ratings of ease were consistent with successful task completion rates. The relatively low SEQ ratings for Tasks 1 and 2 plus the low completion rate for Task 2 showed that although the user experience improved from the first to second rounds of testing, there was still room for improvement.