 A usable product is a better product.
But even the most usable product isn’t adequate if it doesn’t do what it needs to.
Products, software, websites, and apps need to be both usable and useful for people to “accept” them, both in their personal and professional lives.
That’s the idea behind the influential Technology Acceptance Model (TAM). Here are 10 things to know about the TAM.
1. If you build it, will they come? Fred Davis developed the first incarnation of the Technology Acceptance Model over three decades ago at around the time of the SUS. It was originally part of an MIT dissertation in 1985. The A for “Acceptance” is indicative of why it was developed. Companies wanted to know whether all the investment in new computing technology would be worth it. (This was before the Internet as we know it and before Windows 3.1.) Usage would be a necessary ingredient to assess productivity. Having a reliable and valid measure that could explain and predict usage would be valuable for both software vendors and IT managers.
2. Perceived usefulness and perceived ease of use drive usage. What are the major factors that lead to adoption and usage? There are many variables but two of the biggest factors that emerged from earlier studies were the perception that the technology does something useful (perceived usefulness; U) and that it’s easy to use (perceived ease of use; E). Davis then started with these two constructs as part of the TAM.
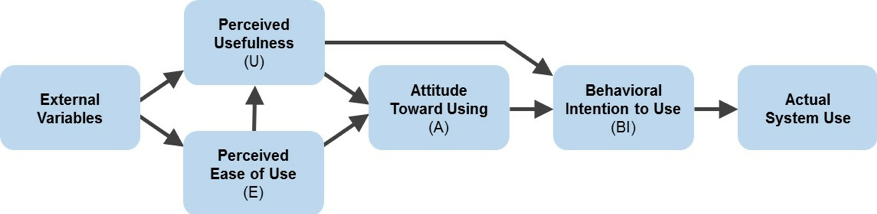
Figure 1: Technology Acceptance Model (TAM) from Davis, 1989.
3. Psychometric validation from two studies. To generate items for the TAM, Davis followed the Classical Test Theory (CTT) process of questionnaire construction (similar to our SUPR-Q). He reviewed the literature on technology adoption (from 37 papers) and generated 14 candidate items each for usefulness and ease of use. He tested them in two studies. The first study was a survey of 120 IBM participants on their usage of an email program, which revealed six items for each factor and ruled out negatively worded items that reduced reliability (similar to our findings). The second was a lab-based study with 40 grad students using two IBM graphics programs. This provided 12 items (six for usefulness and six for ease).
Usefulness Items
1. Using [this product] in my job would enable me to accomplish tasks more quickly.
2. Using [this product] would improve my job performance.*
3. Using [this product] in my job would increase my productivity.*
4. Using [this product] would enhance my effectiveness on the job.*
5. Using [this product] would make it easier to do my job.
6. I would find [this product] useful in my job.*
Ease of Use Items
7. Learning to operate [this product] would be easy for me.
8. I would find it easy to get [this product] to do what I want it to do.*
9. My interaction with [this product] would be clear and understandable.*
10. I would find [this product] to be flexible to interact with.
11. It would be easy for me to become skillful at using [this product].
12. I would find [this product] easy to use.*
*indicate items that are used in later TAM extensions
4. Response scales can be changed. The first study described by Davis used a 7-point Likert agree/disagree scale, similar to the PSSUQ. For the second study, the scale was changed to a 7-point likelihood scale (from extremely likely to extremely unlikely) with all scale points labeled.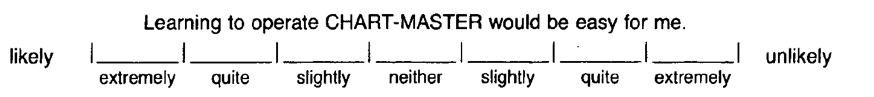
Figure 2: Example of the TAM response scale from Davis, 1989.
Jim Lewis recently tested (in press) four scale variations with 512 IBM users of Notes (yes, TAM and IBM have a long and continued history!). He modified the TAM items to measure actual rather than anticipated experience (see Figure 3 below) and compared different scaling versions. He found no statistical differences in means between the four versions and all predicted likelihood to use equally. But he did find significantly more response errors when the “extremely agree” and “extremely likely” labels were placed on the left. Jim recommended the more familiar agreement scale (with extremely disagree on the left and extremely agree on the right) as shown in Figure 3.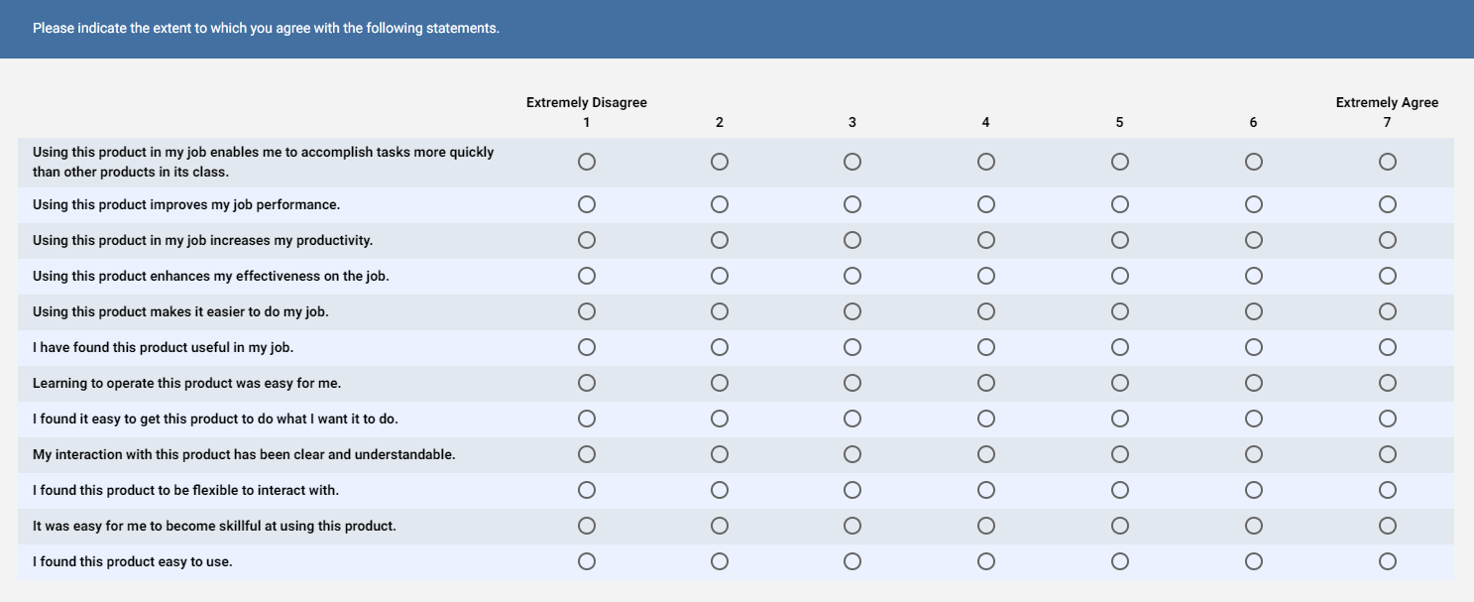
Figure 3: Proposed response scale change by Lewis (in press).
5. It’s an evolving model and not a static questionnaire. The M is for “Model” because the idea is that multiple variables will affect technology adoption, and each is measured using different sets of questions. Academics love models and the reason is that science relies heavily on models to both explain and predict complex outcomes, from the probability of rolling a 6, gravity, and human attitudes. In fact, there are multiple TAMs: the original TAM by Davis, a TAM 2 that includes more constructs put forth by Venkatesh (2000) [pdf], and a TAM 3 (2008) that accounts for even more variables (e.g. subjective norm, job relevance, output quality, and results demonstrability). These extensions to the original TAM model show the increasing desire to explain the adoption (or lack thereof) of technology and to define and measure the many external variables. One finding that has emerged across multiple TAM studies has been that usefulness dominates and ease of use functions through usage. Or as Davis said, “users are often willing to cope with some difficulty of use in a system that provides critically needed functionality.” This can be seen in the original model of TAM in Figure 1 where ease of use operates through usefulness in addition to usage attitudes.
6. Items and scales have changed. In the development of the TAM, Davis winnowed the items from 14 to 6 for the ease and usefulness constructs. The TAM 2 and TAM 3 use only four items per construct (the ones with asterisks above and a new “mental effort” item). In fact, another paper by Davis et al. (1989) also used only four. There’s a need to reduce the number of items because as more variables get added, you have to add more items to measure these constructs and having an 80-item questionnaire gets impractical and painful. This again emphasizes the TAM as more of a model and less of a standardized questionnaire.
7. It predicts usage (predictive validity). The foundational paper (Davis, 1989) showed a correlation between the TAM and higher self-reported current usage (r = .56 for usefulness and r = .32 for ease of use), which is a form of concurrent validity. Participants were also asked to predict their future usage and this prediction had a strong correlation with ease and usefulness in the two pilot studies (r = .85 for usefulness and r = .59 for ease). But these correlations were derived from the same participants at the same time (not a longitudinal component) and this has the effect of inflating the correlation. (People say they will use things more when they rate them higher.) But another study by Davis et al. (1989) actually had a longitudinal component. It used 107 MBA students who were introduced to a word processor and answered four usefulness and four ease of use items; 14 weeks later the same students answered the TAM again and self-reported usage questions. Davis reported a modest correlation between behavioral intention and actual self-reported usage (r = .35). A similar correlation was validated by explaining 45% of behavioral intention, which established some level of predictive validity. Later studies by Venkatesh et al. (1999) also found a correlation of around r = .5 between behavioral intention and both actual usage and self-reported usage.
8. It extends other models of behavioral prediction. The TAM was an extension of the popular Theory of Reasoned Action (TRA) by Ajzen and Fishbein but applied to the specific domain of computer usage. The TRA is a model that suggests that voluntary behavior is a function of what we think (beliefs), what we feel (attitudes), our intentions, and subjective norms (what others think is acceptable to do). The TAM posits that our beliefs about ease and usefulness affect our attitude toward using, which in turn affects our intention and actual use. You can see the similarity in the TRA model in Figure 4 below compared to TAM in Figure 1 above.
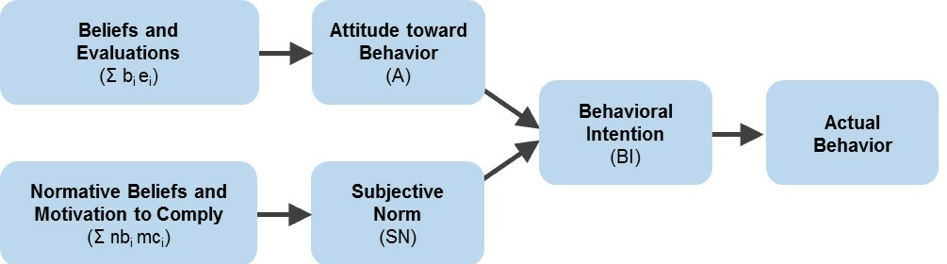
Figure 4: The Theory of Reasoned Action (TRA), proposed by Ajzen and Fishbein, of which the TAM is a specific application for technology use.
9. There are no benchmarks. Despite its wide usage, there are no published benchmarks available on TAM total scores nor for the usefulness and ease of use constructs. Without a benchmark it becomes difficult to know whether a product (or technology) is scoring at a sufficient threshold to know whether potential or current users find it useful (and will adopt it or continue to use it).
10. The UMUX-Lite is an adaptation of the TAM. We discussed the UMUX-Lite in an earlier article. It has only two items which offer similar wording to items in the original TAM items: [This system’s] capabilities meet my requirements (which maps to the usefulness component), and [This system] is easy to use (which maps to the ease component). Our earlier research has found even single items are often sufficient to measure a construct (like ease of use). We expect the UMUX-Lite to increase in usage in the UX industry and help generate benchmarks (which we’ll help with too!).
Thanks to Jim Lewis for providing a draft of his paper and commenting on an earlier draft of this article.