 What is tech savviness?
While it might be hard to define, you probably know someone whom you consider tech savvy—they might even be your go-to person for solving tech issues. Or maybe you know people who aren’t tech savvy and struggle with all technology.
But why should UX researchers care? The concept of tech savviness matters to UX researchers because there is a reasonable belief that differences in tech savviness affect experiences using technologies, attitudes toward technologies, and resulting behavioral intentions to use or recommend technologies.
When we run a UX study such as a formative evaluation or benchmark, we use people to evaluate an interface. We don’t use the interface to evaluate people. We’re not interested in assessing people’s performance; rather, we’re interested in assessing the interface’s performance.
When some users fail a task or take a long time to complete a task, how much of that struggle is caused by the interface? Or conversely, when someone completes tasks effortlessly, how much of that is just their ability to use technology?
Researchers need a way to separate a person’s abilities and differences from an interface’s inabilities. Such individual differences can be demographic (e.g., age, gender), physical (e.g., weight, visual acuity), and psychological (e.g., introverted, field dependent).
For example, an important individual difference in UX research is the amount of prior experience a person has with the product under study. This experience can be measured in at least three ways—tenure (how long), frequency (how often), and depth (how many features). Experience is often significantly related to perceived usability and successful task completion.
In this article, we look at the hypothesized individual difference of tech savviness. First, we consider what tech savviness might be and how to measure it, and then we review the literature to see how others have defined and attempted to measure tech savviness and related concepts.
What Might Tech Savviness Be, and How Might We Measure It?
What Is Tech Savviness?
The words tech savviness imply a depth of knowledge and ease of working with consumer technologies. It’s probably what you have in mind when you think of a tech-savvy family member or friend.
It seems like tech savviness could be affected by numerous other antecedent variables such as education and intelligence. However, we’d expect the most immediate driver to be a broad, prior experience with multiple technologies rather than experience with a single specific product. In other words, someone may know how to operate a complex CNC machine lathe, but that experience doesn’t necessarily apply to wireless routers or advanced mobile phone settings.
Measuring Tech Savviness
There may be various ways to measure tech savviness, including assessment of
- what someone knows.
- what someone does (or reports doing).
- what someone feels (attitudes, especially self-assessments).
What someone knows. The most direct way to assess what someone knows is to give them a quiz (e.g., Figure 1). One challenge is to have as small a set of quiz items as possible that still produces scores with enough variation to classify people at different levels of tech savviness. Another challenge is to keep the quiz items current against the background of constantly changing technologies.

What someone does. Another way to assess the things people do is to provide a checklist of activities and have them indicate which of the activities they are comfortable doing (e.g., Figure 2). As in a quiz, the challenges here are to have as small a set of activities as possible that can produce scores with enough variation for classification and to keep the list of activities relevant.

What someone feels. To assess tech savviness attitudes, you need as small a set of rating questions as possible to get a combined score suitable for classifying different levels of self-rated tech savviness (e.g., Figure 3).

Of course, coming up with ways of collecting tech savviness is the first step. To be sure the data we’re collecting actually map to what we mean by tech savviness involves the essential step of validation.
Validating Tech Savviness
In psychometrics, different concepts of validity are assessed differently (e.g., content validity and construct validity). A fundamental type of validity is criterion-related validity, obtained when there is significant evidence of a relationship between the measure of interest and an outcome (criterion) metric.
For tech savviness, the most compelling criterion-related validation would be evidence of more successful technology task completions by those who are classified as being more tech savvy.
Another less compelling validation would be higher ratings of perceived usability from those who have higher levels of tech savviness.
Literature Review
A lot of literature includes the phrase “tech savvy.” A search for that term on Google Scholar on January 4, 2022, returned over 137,000 results. A similar search on “tech savviness” returned just 6,890 results. Most of this literature refers to tech savviness without any attempt to measure it (e.g., Chandler-Olcott & Mahar, 2003; Wang et al., 2014).
We turned up some literature that includes at least some type of systematic measurement. We found two articles that used standardized questionnaires to assess computer experience and expertise, five that took ad hoc measurements of tech savviness, and two that used the Pew Digital Savviness (PDS) metric.
Standardized Computer Experience/Expertise Questionnaires
In 1996, Miller and Stanney developed the Windows Computer Experience Questionnaire (WCEQ), but they did not publish the questionnaire’s items. They reported high reliability, evidence of construct validity, and some evidence of criterion-related validity. There was a significant positive correlation between WCEQ scores and self-ratings of Windows proficiency. Participants with higher WCEQ scores required significantly less time to complete a series of Windows-based tasks. These results were promising, but given that the questionnaire was focused just on Windows 3.1 and took five minutes to administer, they’re probably of little value to current UX researchers.
Twelve years later, Arning and Ziefle (2008) published a computer expertise questionnaire for use by older adults. They did not publish the entire questionnaire, but they included examples of their two item types: theoretical/conceptual computer knowledge items (definitions of “saving” and “search engine”) and practical/procedural computer knowledge items (how to look up a web address, how to restart a hung computer). They found their expertise questionnaire to be significantly better than a simple rating of experience at predicting task performance. Like the WCEQ, however, this questionnaire is not likely to be of value to current UX researchers due to its length (twenty-minute completion time), its focus on older adults, and technical currency issues.
Ad Hoc Measures of Tech Savviness
Since 2013, several researchers have developed ad hoc measures of tech savviness.
Some researchers did not disclose the details of their ad hoc measures. In a study of the impact of tech savviness and impulsiveness on mobile information search behavior, Dewan and Benckendorff (2013) measured tech savviness with a “set of five-point scales … developed from previous literature on technology anxiety, technophobia, and computer anxiety” (p. 3). They did not specify the items’ wordings or response options. Santos et al. (2018) reported that medical radiology students with higher tech savviness were less concerned that artificial intelligence would replace their jobs but did not report how they measured tech savviness.
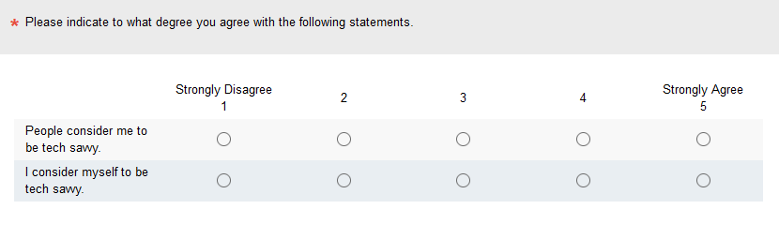
The Sudzina measure has two agreement items: a rating of how others perceive one’s tech savviness and a self-assessment of one’s tech savviness. Sudzina and colleagues (2015 [PDF], 2017) conducted investigations into the effects of gender and the Big Five personality traits on self-perceived tech savviness. In a series of multiple regressions across their studies, they reported significant effects of openness to experience, neuroticism, conscientiousness, and gender on different aspects of tech savviness measured with the two items illustrated in Figure 4 (assessing the tech savviness items individually and their difference).
The Menon measure has three attitudinal agreement items (reading preference, interest in new technology, and web findability). In a structural equation model that used the tech savviness questionnaire shown in Figure 5, Menon (2018) found a significant link between tech savviness and online purchase intention.

The Pew Digital Savviness (PDS) Classifier
As part of a recent series of surveys, Pew Research included a digital savviness classifier that uses the two items shown in Figure 6.

The Pew classification categories are
- Not digitally savvy: Those who use the internet less than once a day and are not very confident.
- Very digitally savvy: Those who use the internet more than once a day and are very confident.
- Somewhat digitally savvy: All others.
Many researchers use Pew Research survey data for their analyses, and some have used the PDS. For example, Mitchell et al. (2018) reported that digitally savvy Americans were much more likely to distinguish between factual and opinion news statements. More recently, Robinson et al. (2021) found effects of digital savviness (which they referred to as “digital confidence”) on COVID-19 comprehension and pandemic anxiety (higher savviness led to better comprehension and lower anxiety).
Summary and Takeaways
The ability to measure tech savviness could be of considerable value to UX researchers so they can disentangle the individual differences and abilities of study participants from the potential strengths and weaknesses of the interface they are evaluating.
There are at least three approaches to measuring tech savviness: assessing (1) what a person knows, (2) what a person does (or reports doing), and (3) what a person feels (attitudes, especially tech savvy self-assessments).
A handful of researchers have published a variety of ways to measure these individual differences.
Researchers who developed standardized questionnaires of computer experience and expertise tended to focus on what respondents knew, assessing their instruments’ criterion-related validity by correlating questionnaire scores with task completion rates. A key difficulty with this approach is keeping the quizzes up-to-date as technologies change.
We found three published tech savviness questionnaires. The Sudzina questionnaire has two self-assessment items; the Menon measure has three attitudinal agreement items; and the Pew Digital Savviness classifier has two items, one about reported behavior (frequency of internet use) and one for online confidence.
All three have been successfully used in the research contexts for which they were developed, but none of them has undergone criterion-related validation against successful task completion or levels of perceived usability, so they are not clearly useful for classifying the tech savviness of participants in UX research.
There is a clear need for additional research on these or related measures of tech savviness. In particular, metrics based on lists of things people are comfortable doing might work as well as or better than metrics based on quizzes or short attitudinal/self-assessment questionnaires. Of course, we’ve taken up the challenge and will discuss the results of our tech-savvy research in upcoming articles.