 The NASA TLX is a multi-item questionnaire developed in 1980 by Sandra Hart.
NASA is, of course, the US-based space agency famous for the one giant leap for mankind.
The TLX stands for Task Load Index and is a measure of perceived workload.
If you conduct mostly digital UX research for consumers (websites and software), you may not have used the NASA TLX, but as interfaces continue to evolve, you may encounter it soon. Here are ten things to know about this influential measure of workload.
- Wide application for physical and digital experiences: Since its publication in the 1980s, the TLX has been cited hundreds of times [pdf] and used in a variety of fields from aircraft certification, operating rooms, nuclear power plant control rooms, simulated combat, and website design. While most applications of the TLX are for interfaces that have a physical component (e.g., aircraft cockpits), any interface experience requires some level of workload and consequently CAN make use of the TLX. Like other UX metrics and questionnaires, it’s ideally used NOT to tell you what to fix, but will help you understand whether changes to an interface improved (or worsened) the workload.
- Measures workload: The TLX is a measure of perceived workload. Workload, like usability, is a complex construct but essentially means the amount of effort people have to exert both mentally and physically to use the interface. Hart and her colleagues operationalized workload using six dimensions: Mental, Physical, and Temporal Demands, Frustration, Effort, and Performance. She makes a compelling case that the perception of workload may be a better measure than trying to find an objective measure of workload (such as heart rate) that may vary too much based on the nature of the task.
- Two step scoring: Administering the TLX involves two steps. First, a participant reflects on the task they’re being asked to perform (such as a nurse admitting a patient to the emergency room) and looks at each paired combination of the six dimensions to decide which is more related to their personal definition of workload as related to the task. This results in a user considering 15 paired comparisons. For example, they need to decide whether Performance or Frustration “represents the more important contributor to the workload for the specific task you recently performed.” The second step involves participants rating each of the six dimensions on scales from Low to High or from Good to Poor (see #6). The raw score for each of the six items is multiplied by the weight from step 1 to generate the overall workload score per task.
- Weights are NOT used often: In practice, many researchers skip the weighting step, which reduces the amount of time needed to administer the TLX, and analyze the raw TLX responses. Several studies have compared raw TLX scores to weighted TLX scores and have found mixed results (some showing better sensitivity when removing weights, others showing no difference, and others showing less sensitivity). See Hart (2006) [pdf] for a more detailed discussion. This ranking step is similar to the procedure used with another measure, the Subjective Workload Assessment Technique (SWAT), where participants rank 36 paired comparisons. Somewhat ironically, these mental effort scales tend to require a fair amount of effort themselves!
- Validated across 16 studies: A good measure is psychometrically validated to ensure it measures what it intends to measure and generates consistent responses. Hart validated the TLX by first having people in a wide range of occupations provide words associated with workload, and she identified ten factors in those responses (later narrowed to nine). Across 16 studies, 247 participants rated multiple task experiences resulting in 3,461 datapoints across a variety of task types, classified as a single cognitive or physical task, a FITTSBERG (movement and memory), and Popcorn (certain tasks “pop” in priority). The factors correlated with each other (ranging from r = .28 to .76). Hart narrowed down the final set down to six dimensions based on which had the highest contributions to a multiple regression equation that would predict the perception of overall workload.
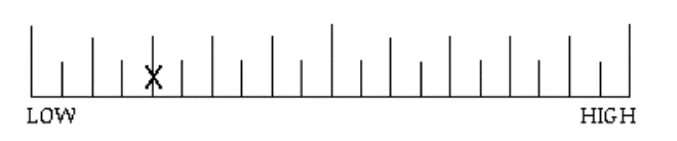
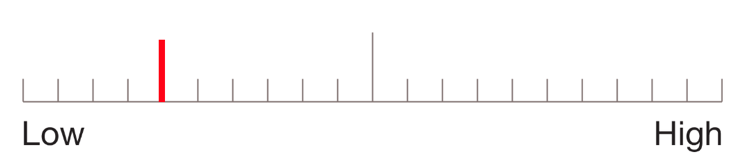
- Response scales differ: The original validation [pdf] done by Hart and her colleagues used a graphical scale presented as a 12 centimeter line without numbers and with bipolar descriptions of either Low/High or Poor/Good. Participants answered on a paper version (available for download). The response scale is essentially a line with 21 marks (see Figure 1).


Figure 1: Example of how the TLX is scored on paper (top) and in the mobile app (bottom).
To score, you count the number of lines a participant marked, subtract 1, and multiply by 5. For example, in Figure 1, the score would be 20: (5-1) x 5. If you use a five- or seven-point scale, you can use a coding system similar to the SUS, which transforms the raw responses to map to a hundred-point scale.
In a review of the research, many people use a five- or seven-point scale for each of the items or use the graphical scales provided by the NASA mobile app or paper and pencil version.
- Lack of benchmarks: Neither the original scale nor the subsequent work has provided researchers with normalized data to understand what is an acceptable or unacceptable workload. Hart herself calls this a desire to identify the “red line” or the point on the scale that indicates when workload is not just high, but too high. For example, the SUPR-Q, SEQ, and SUS have thresholds that indicate when an experience moves from average to unacceptable. Part of the reason for lack of normed data is the varying use of scales (five or seven point, paper version or visual analog scales in the mobile app). It’s possible with its wide usage that individual datasets can be combined on hundred-point scales. Some limited set of benchmarks can be derived from the original validation studies. For example, the average mental effort score across the 16 studies was 42 as shown in Figure 2.

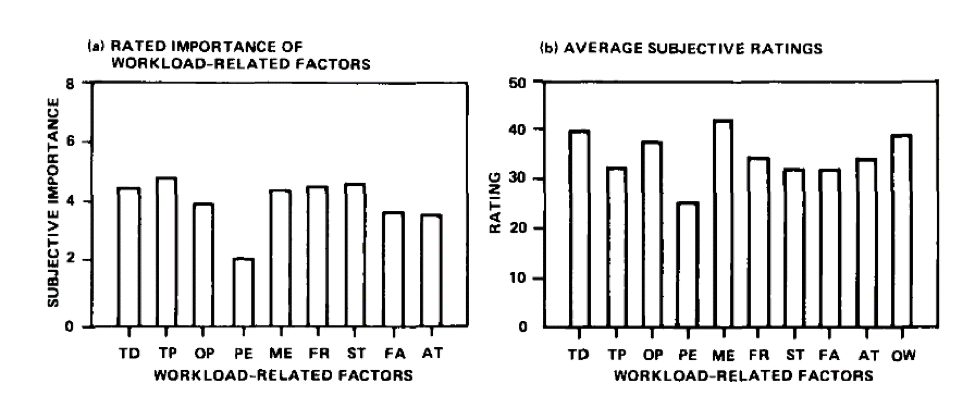
Figure 2: Mean ratings of importance (left side) and average scores for the nine workload factors. Lowest is Physical Effort PE 25 and highest is Mental Effort ME at 42 (from Hart, 2006).
- Dimensions correlate: Hart showed that the six dimensions correlate with each other. However, she didn’t conduct a factor analysis to see whether the six items represent a single dimension or multiple dimensions. Other researchers have also found the subscales are significantly correlated with each other and Hart generally thinks the items “are all measuring some aspect of the same underlying entity.” Researchers should consider the factors as correlated and likely measuring one dimension unless another analysis suggests otherwise. This can be especially important if each of the six items is being treated as an independent measure.
- TLX correlates with other scales: The TLX isn’t the only measure of workload. The TLX has been shown to correlate with other simpler measures, such as the Overall Workload (OW) scale, a single item 20-step questionnaire. The TLX also correlates with the SWAT questionnaire, which uses both the ranking procedure and a conjoint scale, as well as the Workload Profile (WP) scale. We use and recommend the Single Ease Question (SEQ) as a quick measure of perceived difficulty and it’s unclear whether the addition of the six items (not including the calibration exercise) is worth the additional effort. While we don’t measure a lot of tasks where workload is a primary metric, in one study with ten participants we collected the SEQ with the TLX and found the average correlation was quite strong for the overall measure (r = -.89) and for the six dimensions (r = -.57 to r= -.95), suggesting good convergent validity (and overlap). A future analysis can examine what the TLX adds over a simpler measure of OW or the SEQ.
- Reference task may be helpful: Some research has suggested that providing a reference task for participants may reduce the between-subjects variability by better calibrating respondents with the six items in the scale. This was something we found when using the Magnitude Estimation[pdf]. When participants are less familiar with a scale format, giving them some practice can help reduce the variability and error in measurement. For example, participants can first be given a task with known difficulty, such as a mental computation task, and then asked to rate its difficulty using the scales. A facilitator can then answer questions about its usage without worrying about impacting the actual tasks in the study.