 Netflix has been in the news a lot lately. Unfortunately for the wrong reasons.
The popular home DVD and streaming movie services has come under a bit of a customer revolt after increasing pricing and changing services.
While Netflix is largely a US based service and this controversy may only be temporary it does offers some interesting insights for anyone measuring customer loyalty and trust—or any attitudinal measures to predict future behavior.
I maintain a large database of website metrics to support the SUPR-Q standardized questionnaire. One of the highest scoring websites I track is Netflix. In February of this year (2011) I asked 100 Netflix customers a battery of standardized questions that taps into their loyalty and trust of the Netflix website (which is largely synonymous with the company and brand).
I then asked another set of 100 customers the same questions over the last few days (October 7th-10th 2011). The numbers look bad across the board.
Net Promoter Scores Plummet
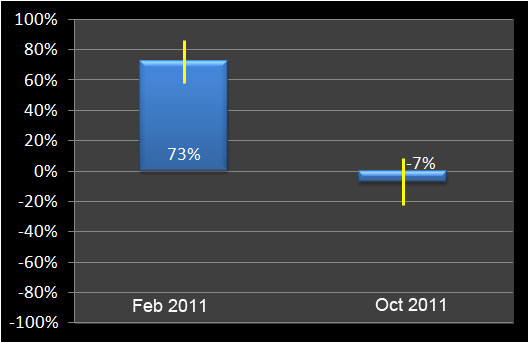
First I asked the popular likelihood to recommend question which is used to compute the Net Promoter Score. Rarely is an effect this substantial and the graph clearly shows the drop in loyalty.

Figure 1: Net Promoter Scores from 100 Netflix customers in Feb and Oct 2011. Yellow Error bars are 95% confidence intervals.
The Net Promoter Score went from a lofty 73% to a paltry -7%. A statistically significant and substantial drop of 80 percentage points. That means there are more customers dissuading others (detractors) from using the service than there are promoters.
Credibility, Usability and Appearance also Sag
Next I looked at credibility and trust. The are attributes measured using the SUPR-Q. In January of 2011, Netflix had one of the highest credibility scores among the 200 websites, placing it in the 99th percentile. In October 2011 their credibility took a significant hit, placing it at the 62nd percentile. It’ still above average, but a far fall from being in the top percentile.
| Feb 2011 | Oct 2011 | |
| NPS | 73% | -7% |
| Credibility | 99.8% | 62% |
| Usability | 99.7% | 73% |
| Appearance | 99.7% | 80% |
Users also find the usability of the website to be lower, going from the 99th percentile to the 73rd percentile. This may have to do with confusion over splitting the website into two services but it may also be a negative halo cast from users overall soured attitude. This halo affect is supported by also lower scores in the appearance measure which fell from the 99th percentile to the 80th percentile.
It’s likely that the halo casts a light and dark shadow on users attitudes about other related constructs of usability and appearance. Netflix very high scores from earlier this year are likely being boosted by generally favorable attitudes toward the service and brand. This data shows that the carryover effect cuts both ways.
The Bad News for Netflix is Good News to those Measuring
The Net Promoter Score is touted as a leading indicator of revenue. In February 2011 the Netflix NPS was 71%–a generally positive sign. Yet just eight months later the company has lost over half is market value and over 1 million customers. Does this invalidate the Net Promoter score and other metrics intended to predict growth?
One good way to answer that question would be to see how a subset of customers would react to the change before implementing it to the whole customer base. Perhaps Netflix did perform such testing and they did anticipate losing customers. The much larger loss is likely due to other factors and perhaps untested customer correspondence and the geometric effect of negative word of mouth.
Metrics are of course just a snapshot in time and provide a pulse of customer attitudes about the known company information when the data are collected. No metric can account for all the variables that will affect customer behavior and company growth. But the good news is, they do track salient aspects of a proposed change. The Netflix metrics clearly reflect the dissatisfied customer base and corresponding loss of market value. As such, metrics can help predict whether design changes to a new website or product will hurt or help the customer experience.
A change in prices, services and some poor customer contacts and you get a seismic shift in attitudes. These attitudes cascade into secondary aspects like usability and appearance and can result in the precipitous slide in many key business metrics. Whether this slide is temporary or a larger trend remains to be seen. For now the latest metrics suggest the bleeding hasn’t stopped as current customers both cancel their subscription and tell their friends about what they did. Let Netflix remind you of the value of tracking customer experience metrics early and often–especially around changes that will impact your customers.


