 As if the Net Promoter Score didn’t already stir up enough strong opinions about whether it’s the “right” metric for organizations, now there’s a new controversy: how to display it.
In case you’re unfamiliar with it, the Net Promoter Score (NPS) is a popular measure of customer loyalty.
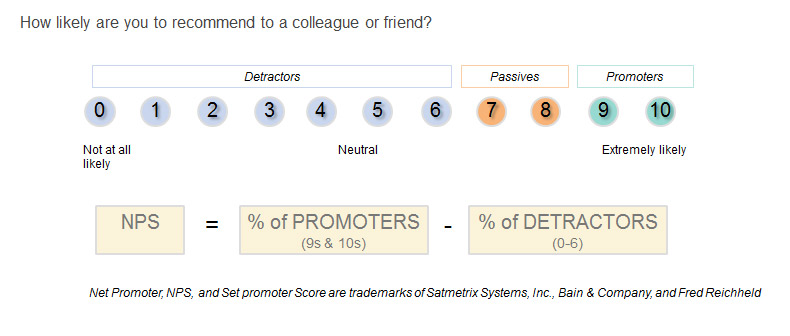
It’s derived by asking a single question to a customer: How likely are you to recommend a product/service to a friend or colleague? Customers respond on an 11-point scale (0 = not at all likely to 10 = extremely likely).

To calculate the Net Promoter Score you subtract the percent of detractors from the percent of promoters. For example, if 100 customers respond to a survey and 50 provide a response of a 9 or 10, then 50% of the respondents are promoters. If 25 customers provide responses between 0 and 6, 25% are detractors. The Net Promoter Score is then 50%-25% = 25%.
And here’s where the controversy sets in: Is it an NPS of 25% or 25? Do you add or omit the percentage sign?
I’ve received a few emails from readers asking (or telling me) what the “right” way is.
An Internet search reveals a commonly used statement: “The NPS is not expressed as a percentage but as an absolute number lying between -100 and +100.”
Unfortunately, none of the articles I found provide a justification or even a source for this rather strong statement (they just point to each other). So what is correct? % or no %?
Original Sources
For as long as I’ve computed the NPS, I’ve expressed it as a percentage as I suspect many people have, too. This may be because it’s how it was originally presented.
In the now famous HBR article, Fred Reichheld clearly uses a percent sign in his graphs to describe the NPS.
Reichheld also in his book, The Ultimate Question, expresses the NPS as a percentage (e.g. scores for Intuit’s business lines range from 27 to 52%; pg. 33). The percentage isn’t universally applied. For example, in Appendix A, he uses a % on the graphs with a Net Promoter Score, but leaves off the percent sign for the graphs that refer to Net Promoters (on the same page). He seems to use a % only when referring to a specific score.
In another book, Answering the Ultimate Question, by Owen and Brooks (CEO and Head of Research at Satmetrix and also copyright holders) they also use NPS with a %.
So some weight should be given to the original authors and copyright holders of the NPS, but being the first to write about it, doesn’t make it right.
To confuse matters, more recently, on the premium reports from the Satmetrix website, they don’t use a percent sign nor do they on the score model page. It could be that my friends at Satmetrix have decreed recently that the NPS is just a number and not a percentage or it could just be a convention.
Percent Considerations
Thinking more mathematically about this issue, the NPS is a difference between proportions (.50 -.25 = .25). Proportional differences are expressed as a proportion, which then gets easily converted as a percentage by moving the decimal over two places (25%).
Percent increase vs. percentage point increase
A difference in two percentages should of course not be confused with a percent change. If the percent of promoters goes from 50% to 75%, that’s a 25 percentage point increase, but it’s also a 50% increase (75%/50% = 1.5). It can be confusing because both can use a percent sign, but as we see, mean different things. But we’re not expressing a percent change when we subtract detractors from promoters; we’re expressing a raw difference in percentage points.
Percentages can go above 100%
While the NPS is bounded between -100% and 100% (or -100 and 100 if you reject the %), percentages can of course go beyond 100%. For example, a conversion rate on a website can increase by 300% (say from .02 to .06).
Percentages can be negative
One argument I’ve seen is that because the NPS can be negative, it doesn’t make sense to use a percentage. While it might be confusing to some to see negative percentages, it’s completely legitimate. For example, a company can have a -10% annual growth rate or -3% margins on their products (a loss leader maybe). The “Net” in Net Promoter Score gets at this. If you have more detractors than promoters, you have a negative NPS, which is something similar to negative “net” margins.
Similarity to displaying an R-squared value (R2 =.45 or 45%)
For a similar formatting question in statistics, there’s the way to present the R-squared value. R-squared is a measure of “fit” used in regression and ANOVA that cannot exceed 1 or 100% but can go below 0 when a model “underfits its data.” Sometimes you’ll see R-squared expressed as a proportion (R2 = .45), while other times it’s expressed as a percent (R2 = 45%).
Focus on the Right Things
The main takeaway from this NPS % tempest in a teapot is that regardless of whether you use a percent sign, it has the same meaning and interpretation. And whether you stand with the % or against it, there are at least three things you should concern yourself with more:
- What’s good: A “good” Net Promoter Score varies by industry and even the context you collect it in. You’ll want to compare your NPS to industry benchmarks and itself over time.
- What’s certain: Don’t be fooled by random noise. Use a confidence interval to help differentiate real changes from sampling error. With a difference in two proportions, the margin of error is actually twice as wide as a single percent!
- What to improve: You’ll want to improve your Net Promoter Score by understanding its key-drivers. In software and websites, functionality and usability play a major role. You’ll want to do more than measure your NPS, you’ll want to move it from say 25% to 50%.
Whether to use a percentage with the NPS has less to do with math and more to do with style. And when we deal with style it seems the opinions of what’s right and what’s wrong get much stronger and polarized. Don’t you agree…100%, or should I say 100?


