 People spend a lot of money (and time) on online purchases, most of that on what we call mass merchant retail websites.
The US Census Bureau estimates Q3 2025 retail e-commerce sales at $310B (15.8% of total retail sales that quarter). Spending continues to grow but is tempered by inflation, making shoppers more economically pessimistic and price-sensitive, and less tolerant of extra fees.
In general, when purchase volume is high, competition tends to be strong and margins thin. To stand out, providers need to provide online experiences that are reliable, frictionless, and high in perceived value.
To understand the quality of their online experiences, we collected UX benchmark metrics on seven popular mass merchant websites and mobile apps.
- Amazon
- JC Penney
- Kohl’s
- Macy’s
- Target
- TJ Maxx
- Walmart
We computed SUPR-Q® and Net Promoter scores, measured users’ attitudes regarding their experiences, conducted key driver analyses, and analyzed reported usability problems. Full details are in the downloadable report.
Benchmark Study Details
In November to December 2025, we asked 351 U.S. users of mass merchant websites to recall their most recent experience and perceptions of one of these websites on their desktop and mobile app (if applicable) in the past year.
Respondents completed the eight-item SUPR-Q (which includes the Net Promoter Score), the two-item UX-Lite®, and the SUPR-Qm® standardized questionnaires, and they answered questions about their brand attitudes, usage, and prior experiences.
Quality of the Website User Experience: SUPR-Q
The SUPR-Q is a standardized questionnaire widely used for measuring attitudes toward the quality of a website user experience. Its norms are computed from a rolling database of around 200 websites across dozens of industries.
SUPR-Q scores are percentile ranks that tell you how a website’s experience ranks relative to the other websites (50th percentile is average). The SUPR-Q provides an overall score as well as detailed scores for subdimensions of Usability, Trust, Appearance, and Loyalty.
The mean SUPR-Q across mass merchant websites in this study was at the 54th percentile (just above average), ranging from the 75th percentile for TJ Maxx to the 12th percentile for Walmart.
Usability Scores
Overall, usability scores were slightly above average for the mass merchant websites, averaging at the 60th percentile. Amazon had the highest usability score at the 78th percentile. Walmart had the lowest usability score, falling at the 15th percentile.
Comments related to usability on Walmart included:
“There are times when I can’t find something that I need or it can only be bought in bulk from the website.”
“Searching for something as simple as men’s pants, there’s no easy way to narrow down choices by specific size availability or other parameters.”
Loyalty/Net Promoter Scores
All the mass merchant websites except Walmart (with −30%) had positive Net Promoter Scores, led by TJ Maxx (25%) and Amazon (21%). The average NPS for these websites was 6% (slightly more promoters than detractors).
Unsurprisingly, ratings of the intention to keep using these websites correlated with their NPS (r = .55 at the website level). As shown in Figure 1, respondents were more likely to continue using the websites for Amazon, Kohl’s, Macy’s, and TJ Maxx than to continue using Target, Walmart, or JC Penney.
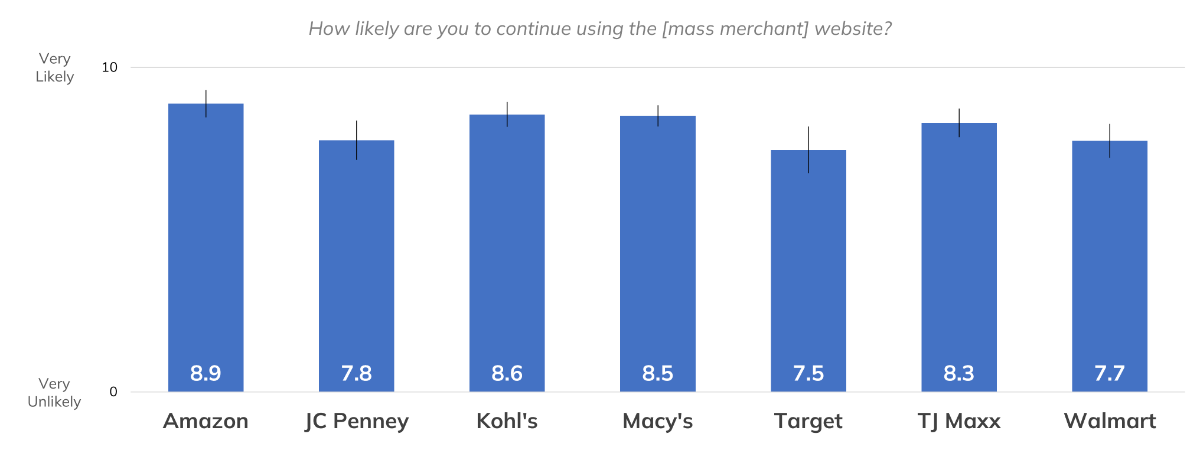
Figure 1: Likelihood to continue using the websites (90% confidence intervals).
Comments related to NPS and loyalty included:
“First of all, I love TJ Maxx in general and shop there often. I tend to shop in person mostly, but I do go on the website to check for deals and items. I would recommend the website to a friend who doesn’t have easy access to a physical store so they could see all the great items they carry.” — TJ Maxx
“I’d be happy to refer Amazon to a friend or colleague as it offers a ton of valuable things including fast shipping, an ability to comparison shop easily, movies to watch, free shipping if you join Prime, and super easy returns. Many, many reasons to recommend Amazon. Also, I have rarely had a problem and when I did it was solved quickly.” — Amazon
“The Walmart website has gotten very difficult to use over the years. You have to use a lot of filters in order to see things that Walmart stores actually have available to pick up in store. Many, many items on the website are Chinese products that are available by shipping only. It feels very 3rd party and untrustworthy. Walmart has little affiliation with these products.” — Walmart
Websites and Mobile App Usage
As a part of this benchmark, we asked respondents how they accessed the mass merchants online. All respondents reported using their desktop/laptop computers (this was a requirement for participation in the survey); 52% of respondents also used mobile apps, and 69% also used mobile websites. Most respondents reported visiting their mass merchant websites on a desktop or laptop computer from a few times a year (Kohl’s, Macy’s, TJ Maxx) to never (Amazon, JC Penney, Target, Walmart). For all but one retailer, most respondents reported never using a mobile app—the exception was Amazon, for which most respondents reported using the mobile app a few times a week.
Key Drivers of UX Quality
To better understand what affects SUPR-Q scores and Likelihood-to-Recommend (LTR) ratings, we asked respondents to rate potentially important attributes of the mass merchant websites on a five-point scale from 1 (Strongly disagree) to 5 (Strongly agree). We conducted key driver analyses (regression modeling) to quantify the extent to which ratings on these items drive (account for) variation in overall SUPR-Q scores and, separately, LTR (the rating from which the NPS is derived; full details are in the downloadable report).
The top key driver of the overall SUPR-Q scores was the ease of browsing for items (13%), followed by finding inspiration for products (9%) and having clear product images (8%). Taken together, 11 significant variables accounted for 71% of the variance in the SUPR-Q scores.
For likelihood-to-recommend (LTR), the top key drivers were easily finding deals (10%), clear product images (9%), and finding inspiration for products (8%). Overall, six significant drivers accounted for 45% of the variance in LTR.
Figure 2 shows a scatterplot of the importance and opportunity for improvement for seven key drivers (the top SUPR-Q and LTR drivers and drivers that accounted for significant percentages of their variation). The combination of importance and opportunity for improvement provides a basis for prioritizing which key drivers to improve. The importance score is the greater of the variance accounted for by the driver in the SUPR-Q and NPS analyses, where larger percentages indicate more importance.
The opportunity score is the top-box percentage for the driver, so smaller percentages indicate greater opportunity for improvement (e.g., it would be harder to improve a driver with a top-box percentage of 100% than one with a top-box percentage of 10%).
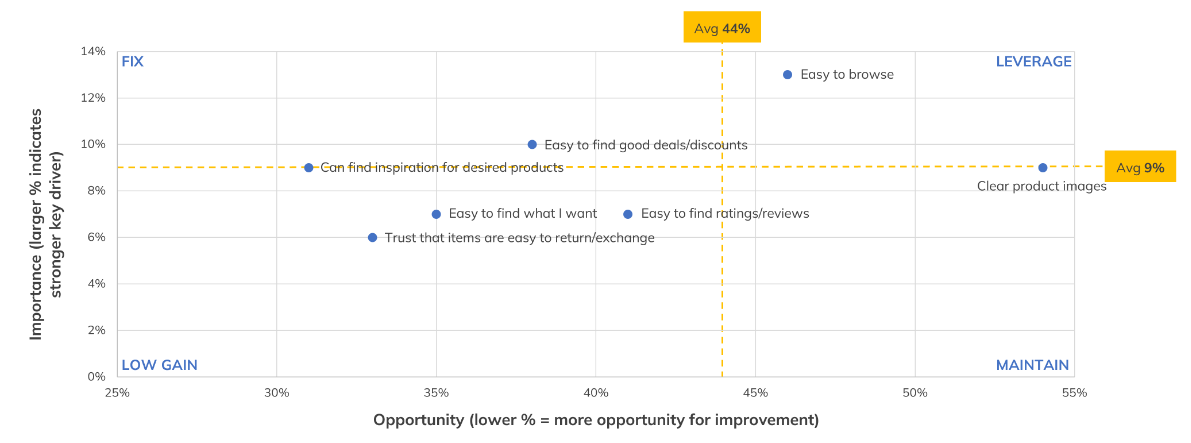
Figure 2: Scatterplot of importance and opportunity for improvement of key drivers.
Two of these seven key drivers fell in the upper left quadrant with relatively high importance and higher opportunity for improvement (“Can find inspiration for desired products” and “Easy to find good deals/discounts”). TJ Maxx was the leader on these drivers with respective top-box scores of 52% and 50%, while Walmart had the lowest scores (15% and 21%, respectively).
UX Problems
We examined verbatim comments to better understand user experience problems.
The top themes were cluttered designs, stocking issues, and item quality.
Cluttered Designs
Comments about cluttered designs dominated the comments for JC Penney (Figure 3), Kohl’s, Macy’s, and TJ Maxx, and clutter was the second-most mentioned problem with Target. Comments related to clutter included:
“Like previously mentioned, to me it’s just a big eyesore and I hate trying to navigate through it. It feels outdated and excessively ugly compared to almost any other online retailer that is popular these days, unfortunately.” — JC Penney
“It is far too cluttered with an outdated design.” — Kohl’s
“I’ve never had any specific problems with the website. I wish it were slightly more ‘clean’ looking. Sometimes I find it to look cluttered.” — Macy’s
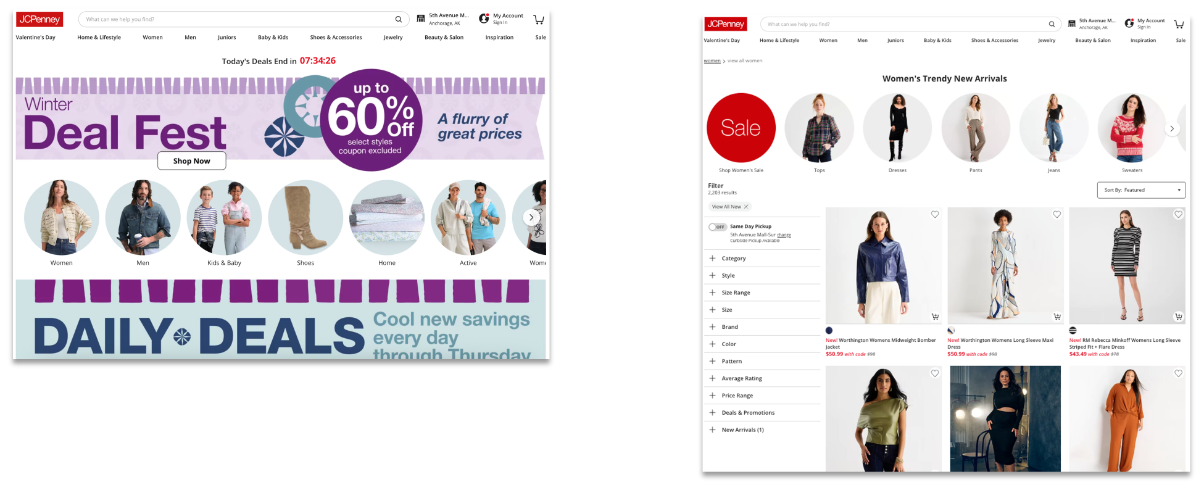
Figure 3: Example of clutter on the JC Penney website.
Out-of-Stock Items
Items being out of stock was the most cited problem for Target (Figure 4) and was in the top three for TJ Maxx, Walmart, JC Penney, and Kohl’s.
Comments related to out-of-stock items included:
“I sometimes have a problem with an item being out of stock when I want to make a purchase.” — Target
“My family often looks for items prior to going to the physical store to get the items. Unfortunately, there are often times when the website shows that items are available locally that end up not being in stock.” — JC Penney
“All stores have an ever-changing product availability, so it’s hard to know when and where certain items become available.” — TJ Maxx
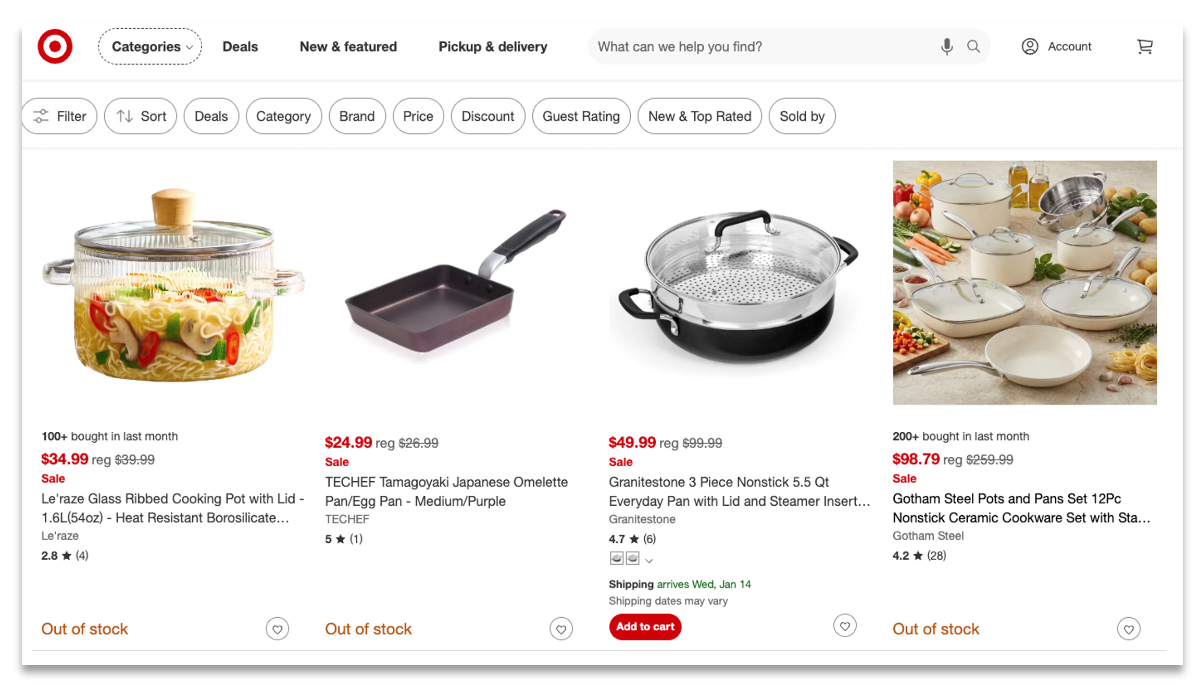
Figure 4: Out-of-stock items on the Target website.
Third-Party Sellers Drag Down the Experience on Walmart
The most frequently mentioned issues for Amazon and Walmart were related to item quality, often related to poor prior experiences and resulting trust issues with third-party sellers. Walmart shoppers also reported having difficulty distinguishing products sold by third-party sellers and those sold by Walmart in search results, as this information appears only on the item details pages (Figure 5).
Comments related to item quality included:
“Amazon has loads of fake reviews and I have received counterfeit products when buying electronics in the past. I have become a lot more cautious regarding what I buy on Amazon.”— Amazon
“One thing I don’t like is an uptick in 3rd party sellers that sometimes seem shady.”— Walmart
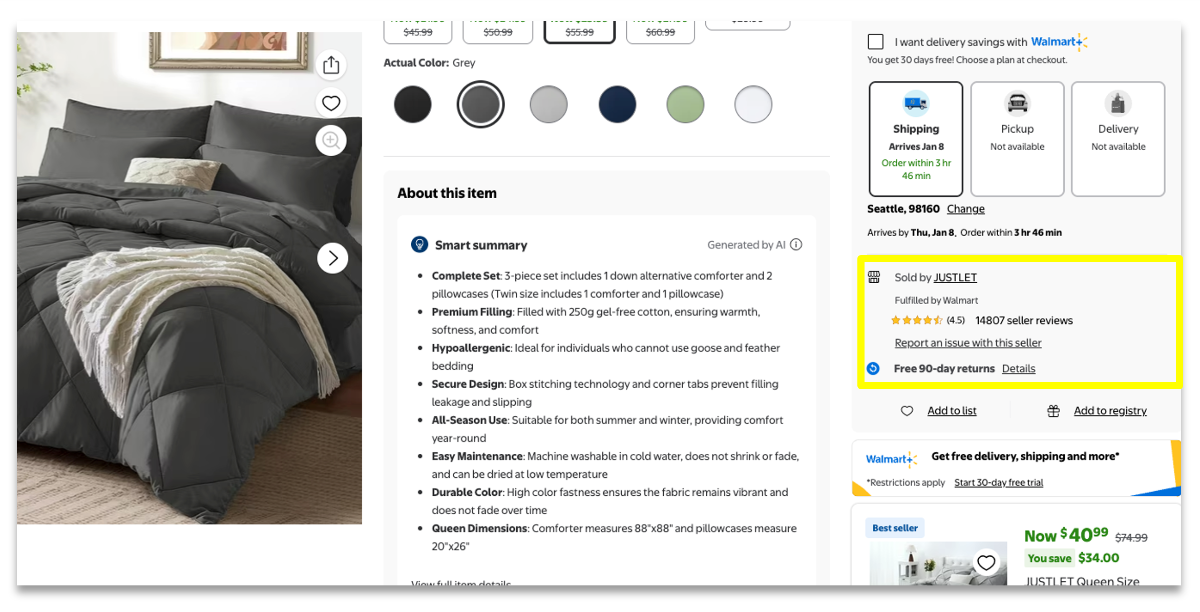
Figure 5: Example of a third-party seller on the Walmart website.
Comparison with the 2021 Mass Merchant Benchmark
In 2021, we collected SUPR-Q and NPS data for Amazon, Kohl’s, Macy’s, Target, and Walmart. Figure 6 shows a statistically significant decline in the UX of all five websites from 2021 to 2025 and low scores for Walmart compared to other websites in both surveys. The patterns for NPS were similar.
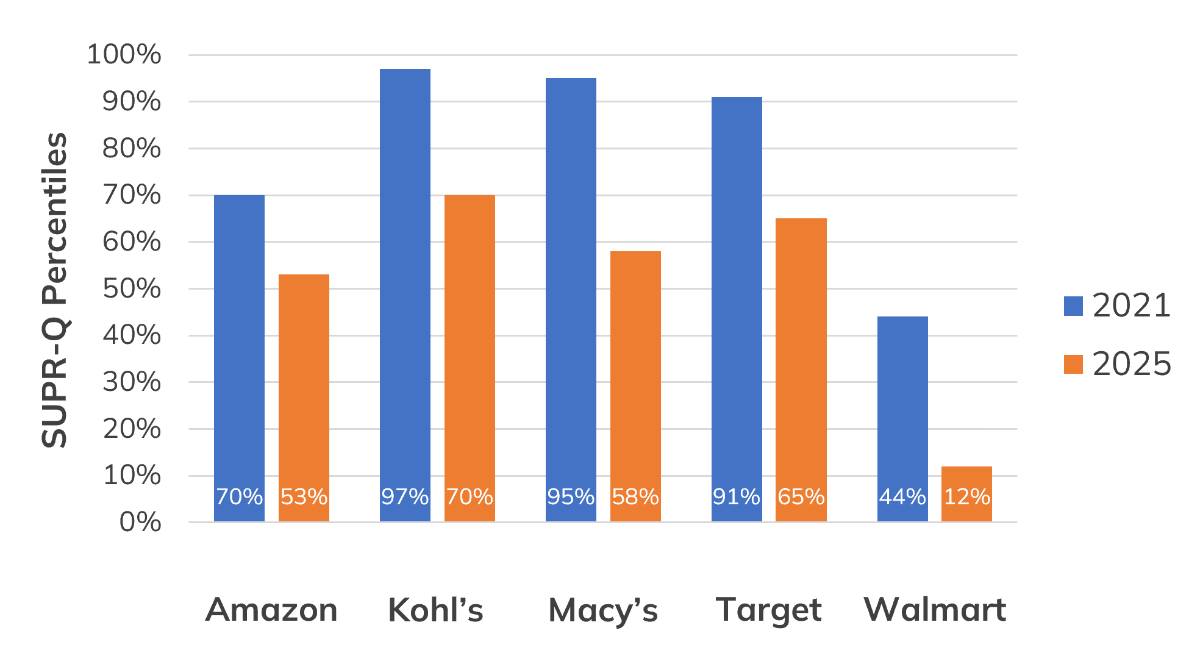
Figure 6: SUPR-Q scores from the 2021 and 2025 surveys (statistical analysis conducted on raw scores).
UX scores were likely inflated in 2021 by the COVID pandemic, when online shopping wasn’t just convenient but was often the default (or safest) option, with positive sentiments flowing to the companies that were saving the day during the disruption.
The UX scores in 2025 mark a return to normalcy with higher expectations and lower tolerance for friction, exacerbated by poor customer sentiment due to lingering effects (real and perceived) of post-pandemic inflation.
Notably, the problem with third-party seller quality has been a strong drag on Walmart’s UX quality since we measured it in 2021 (the most mentioned problem then and in 2025).
Summary and Takeaways
Mass merchant services are big business in the US, with estimates for Q3 2025 retail e-commerce sales at $310B (15.8% of total retail sales that quarter). An analysis of the user experience of seven major mass merchant websites using data collected from November-December 2025 found:
- TJ Maxx led while Walmart lagged. The mass merchant websites in this study collectively had SUPR-Q scores at the 54th percentile, just above the average 50th percentile. SUPR-Q scores ranged from the 12th percentile for Walmart to the 75th percentile for TJ Maxx. TJ Maxx was most likely to be recommended (NPS of 25%) while Walmart was the least likely (NPS of −30%).
- Ease of browsing and ease of finding deals and discounts drive UX scores. Our key driver models accounted for 71% of the variation in SUPR-Q scores and 45% of the variation in LTR ratings. The top key driver of the mass merchant website experience was “It’s easy to browse for items on the website” (accounting for 13% of SUPR-Q variation). The top key driver in the modeling of LTR ratings was “I can easily find deals and discounts” (10%).
- There are opportunities to improve influential key drivers. One way to prioritize attention to key drivers is to consider both their importance (beta weights in regression) and how well the websites achieve the stated goal (top-box scores). The two key drivers with the most potential for improvement (high beta weights and low top-box scores) were the extent to which the websites help users find inspiration for desired products (top-box score: 31%) and the ease of finding good deals/discounts (top-box score: 38%). TJ Maxx was the leader on these drivers with respective top-box scores of 52% and 50%, while Walmart had the lowest scores (15% and 21%, respectively).
- Top UX problems reported by users were cluttered design, stocking issues, and item quality. Comments about cluttered designs dominated the comments for JC Penney, Kohl’s, Macy’s, and TJ Maxx, and clutter was the second-most mentioned problem with Target. Items being out of stock was the most cited problem for Target and was in the top three for TJ Maxx, Walmart, JC Penney, and Kohl’s. The most frequently mentioned issues for Amazon and Walmart were related to item quality, often related to poor prior experiences and resulting trust issues with third-party sellers.
- Third-party sellers pose a threat to the UX of mass merchant websites (especially Walmart). Third-party seller quality has been a strong drag on Walmart’s UX quality, with that being the top user complaint for Walmart in 2021 and 2025. It has likely also affected the UX ratings of Amazon and Target, where it wasn’t the top complaint but made it into the top 10.
For more details, see the downloadable report.