 It’s hard to beat the convenience of shopping for clothing online. You don’t have to worry about when the store will close or finding parking, and getting a price comparison with other stores is just a few clicks away. On websites, you can easily search for clothing using keywords, and it’s simple to see the entire catalog. There’s no reason to hunt through aisles or track down a salesperson.
But shopping for clothing online also has its drawbacks. You can’t try on the clothing. Not being able to walk the store means you’re reliant on the organization of the website. And just because you see it doesn’t mean it’s in stock. If you receive the wrong size, you may have to deal with restocking fees and the hassle of return shipping.
Despite these issues, estimated online clothing spending in 2025 in the U.S. was about $217B (about a fifth of global online apparel spending). However, online clothes spending in 2025 was only about 38% of all clothing purchases, making the improvement of the UX of clothing websites a high priority for providers and consumers.
To understand the quality of their online experiences, we collected UX benchmark metrics on 11 popular clothing websites and mobile apps.
- Anthropologie
- Athleta
- Banana Republic
- Gap
- H&M
- Lululemon
- Neiman Marcus
- Nordstrom
- Old Navy
- Urban Outfitters
- Zara
We computed SUPR-Q® and Net Promoter scores, measured users’ attitudes regarding their experiences, conducted key driver analyses, and analyzed reported usability problems. (Full details are in the downloadable report.)
Benchmark Study Details
In November to December 2025, we asked 351 users of clothing websites in the U.S. to recall their most recent experience and perceptions of one of these websites on their desktop and mobile app (if applicable) in the past year.
Respondents completed the eight-item SUPR-Q (which includes the Net Promoter Score), the two-item UX-Lite®, and the SUPR-Qm standardized questionnaires and they answered questions about their brand attitudes, usage, and prior experiences.
Quality of the Website User Experience: SUPR-Q
The SUPR-Q is a standardized questionnaire widely used for measuring attitudes toward the quality of a website user experience. Its norms are computed from a rolling database of around 200 websites across dozens of industries.
SUPR-Q scores are percentile ranks that tell you how a website’s experience ranks relative to the other websites (50th percentile is average). The SUPR-Q provides an overall score as well as detailed scores for subdimensions of Usability, Trust, Appearance, and Loyalty.
The mean SUPR-Q across clothing websites in this study was at the 82nd percentile (substantially above average), ranging from the 50th percentile for H&M to the 98th percentile for Banana Republic.
Usability Scores
Overall, usability scores were also well above average for the clothing websites, averaging at the 81st percentile. Old Navy had the highest usability score at the 98th percentile. Zara had the lowest usability score, falling at the 31st percentile.
Comments related to usability on Zara included:
“Unnecessary images between products while browsing.”
“The return process is complicated.”
Loyalty/Net Promoter Scores
All the clothing websites except H&M (with −2%) had positive Net Promoter Scores, led by Anthropologie (40%). The average NPS for these websites was 19% (more promoters than detractors).
Unsurprisingly, ratings of the intention to keep using these websites correlated with their NPS (r = .70 at the website level). As shown in Figure 1, respondents were more likely to continue using the Nieman Marcus website than to continue using the Old Navy website.

Figure 1: Likelihood to continue using the websites (90% confidence intervals).
Comments related to NPS and loyalty included:
“Quality merchandise, great customer service, high-end brands, good sales.” — Nieman Marcus
“It’s a good site but the quality of the clothes are less than they used to be.” — Old Navy
Websites and Mobile App Usage
As part of this benchmark, we asked respondents how they accessed the clothing providers online. All respondents reported using their desktop/laptop computers (this was a requirement for participation in the survey), with 39% also using mobile apps and 73% using mobile websites. Most respondents reported visiting their clothing websites on a desktop or laptop computer a few times a year. Users most frequently reported never using the clothing mobile apps (however, 24% of Athleta users and 33% of Zara users reported using those apps a few times per month).
Key Drivers of UX Quality
To better understand what affects SUPR-Q scores and Likelihood-to-Recommend (LTR) ratings, we asked respondents to rate potentially important attributes of the clothing websites on a five-point scale from 1 (Strongly disagree) to 5 (Strongly agree). We conducted key driver analyses (regression modeling) to quantify the extent to which ratings on these items drive (account for) variation in overall SUPR-Q scores and, separately, LTR (the rating from which the NPS is derived; full details are in the downloadable report).
The top key driver of the overall SUPR-Q scores was the ease of browsing items (12%), followed by the ease of finding “exactly what I want” (10%). Taken together, 11 significant variables accounted for 74% of the variance in the SUPR-Q scores.
For likelihood-to-recommend (LTR), the top key drivers were the ease of finding “exactly what I want” (10%), finding brands quickly (8%), and trusting sites’ style recommendations (8%). Overall, seven significant drivers accounted for 44% of the variance in LTR.
Figure 2 shows a scatterplot of the importance and opportunity for improvement for seven key drivers. The combination of importance and opportunity for improvement provides a basis for prioritizing which key drivers to improve. The importance score is the greater of the variance accounted for by the driver in the SUPR-Q and NPS analyses, where larger percentages indicate more importance. The opportunity score is the top-box percentage for the driver, so smaller percentages indicate greater opportunity for improvement (i.e., it would be harder to improve a driver with a top-box percentage of 100% than one with a top-box percentage of 10%).

Figure 2: Scatterplot of importance and opportunity for improvement of key drivers.
Two of these seven key drivers fell in the FIX quadrant (upper left) with relatively high importance and higher opportunity for improvement (“Exciting to shop on this site” and “Easy to find exactly what I want”). Anthropologie had the highest top-box score for excitement (48%), and Nordstrom had the highest for shoppers being able to find exactly what they want (61%). The websites with the lowest top-box scores, suggesting the most room for improvement, were Old Navy for excitement (16%) and Urban Outfitters for finding “exactly what I want” (25%).
UX Problems
We examined the verbatim comments to better understand the user experience problems.
The top frustrations were products out of stock, sizing issues, slow loading, and navigation/browsing issues.
Products Being Out of Stock Was a Major Annoyance
This issue affected all the websites, but it was a top complaint for Neiman Marcus, Old Navy (Figure 3), and Urban Outfitters (and was in the top five for the others).
“Sometimes things go out of stock quickly.” — Neiman Marcus
“There have been many times where specific items aren’t sold in my size, or they are sold out completely.” — Old Navy
“Some problems I’ve had with the Urban Outfitters website are sometimes things aren’t in stock and they aren’t clear on when they will be back in stock.” — Urban Outfitters

Figure 3: Old Navy’s spin on products being out of stock (“We knew it was too good to last”).
Sizing Issues Degrade the User Experience
Eight of the websites had sizing issues, which was the most frequently-mentioned negative comment for Banana Republic (Figure 4) and Gap.
“Sometimes, there are items that are not in stock or I usually get an incorrect size.” — Banana Republic
“Sometimes the item I want is not available in both my size and color. It will either be available in my size or my color but not both.” — Gap
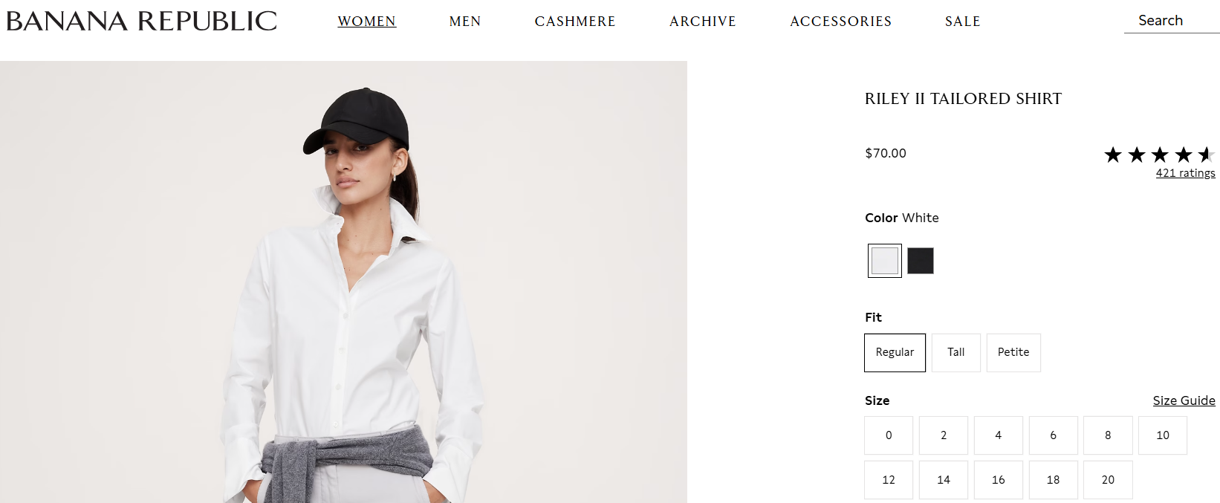
Figure 4: Example of a product review about a sizing issue on the Banana Republic website.
Slow Loading Times Slow Down Shopping
Users reported slow loading times for nine of the websites. It was a top complaint for Athleta and Neiman Marcus and was the second-most reported issue for Gap, Nordstrom, and Urban Outfitters.
“Requires strong internet connectivity to load otherwise one would experience slow performance.” — Athleta
“The website is slow sometimes.” — Neiman Marcus
“Sometimes the website can be slow depending on the device I am using.” — Gap
“Sometimes it is slow to load once I get to page 3 or 4 of options.” — Nordstrom
“Some pages take longer to load than expected, which can be frustrating.” — Urban Outfitters
Navigation and Browsing Issues Prevent Smooth Shopping
Users of ten of the websites reported issues with navigation, browsing, or both. They were the top two most frequently reported frustrations for Anthropologie, Athleta, Gap, H&M, Lululemon, Urban Outfitters, and Zara.
“It is so hard to browse for something or search for something.” — Zara
“It can feel a bit overwhelming to look at at first because it looks like it has a lot going on.” — Urban Outfitters
“It can feel a bit cluttered or too overwhelming to find exactly what I want.” — Gap
We were particularly intrigued by a comment by an H&M user who wrote, “It’s sometimes frustrating that the sidebar appears so frequently while I’m scrolling.” When we investigated this, it was clear that the underlying design issue was an invisible border around the controls that triggered the sidebar. Other websites had similar designs but either visualized the boundary separating menu options from the browsing area (e.g., Anthropologie and most others) or required users to activate dropdowns by clicking the option rather than hovering nearby (Lululemon). Video 1 shows how the H&M design is particularly tricky relative to the other design.
Video 1: Sidebar/dropdown triggering from main menu options on H&M, Anthropologie, and Lululemon.
Online Shoppers Have Trouble Getting Exactly What They Want
The signals we get from both the quantitative and qualitative analyses for this benchmark study clearly indicate that users of these clothing websites have trouble getting exactly what they want.
This is demonstrated quantitatively by the significance of key driver ratings of the ease of browsing, finding brands quickly, trusting a site’s recommendations, easy returns, and confidence in the accuracy of size guides.
The qualitative findings provide more of the “why” behind the numbers, including:
- The annoyance of products being completely out of stock or out of desired sizes/colors, combined with the occasional surprise of not finding out until well into the checkout process
- Uncertainty about sizing chart accuracy and variability in sizing across manufacturers, which leads consumers to experience fit/sizing uncertainty that can cause them to abandon the purchase due to poor fit-risk perception
- Persistent complaints about slow loading
- Numerous navigation and browsing issues (e.g., odd dropdown/sidebar behaviors, large images/videos that sometimes do not resize, intrusive ads, complex checkout and return processes)
Looking across the quantitative and qualitative findings, all 11 websites have opportunities to improve. Some websites that would especially benefit from a stronger focus on online shopping experiences are:
- Urban Outfitters: Lowest top-box score for finding “exactly what I want” (25%) and relatively high percentage of user comments about products being out of stock (top complaint), slow loading times, and navigation/browsing issues
- Old Navy: Lowest top-box score for excitement while shopping on the site (16%) and relatively high percentage of user comments about products being out of stock (top complaint)
- Zara: Lowest SUPR-Q Usability score (31st percentile) and relatively high percentage of user complaints, including browsing/navigation issues
- H&M: Lowest overall SUPR-Q score (50th percentile) and NPS (−2%) with a relatively high percentage of user complaints, including browsing/navigation issues
Comparison with the 2022 Clothing Benchmark
In 2022, we collected SUPR-Q and NPS data for all the same websites. Banana Republic, Gap, and Zara had the most improvement. Zara increased by more than 50 points in the four years since we measured (though still lagging behind the leaders), and H&M had the biggest drop (32 points). These differences, shown in Figure 5, are statistically significant [F(10, 995) = 1.89, p = .04].
Figure 5: SUPR-Q scores from the 2022 and 2025 surveys (statistical analysis conducted on raw scores).
Summary and Takeaways
Clothing companies are big businesses with an estimated online clothing spending in the U.S. of about $217B in 2025 (about a fifth of global online apparel spending). An analysis of the user experience of 11 major clothing websites using data collected in November–December 2025 found:
- Banana Republic and Anthropologie lead; H&M lags. Banana Republic had the highest overall SUPR-Q score, falling in the 98th percentile, while H&M had the lowest score (50th percentile). Anthropologie had the highest NPS (40%) and H&M had the lowest (−2%).
- Ease of browsing and ease of finding “exactly what I want” drive UX scores. The top key driver of the overall SUPR-Q scores was the ease of browsing items (12%), followed by the ease of finding “exactly what I want” (10%). Taken together, 11 significant variables accounted for 74% of the variance in the SUPR-Q scores. For likelihood-to-recommend (LTR), the top key drivers were the ease of finding “exactly what I want” (10%), finding brands quickly (8%), and trusting sites’ style recommendations (8%). Overall, seven significant drivers accounted for 44% of the variance in LTR.
- The top opportunities for improvement are increasing the feeling of excitement when shopping and helping shoppers find what they want. One way to prioritize attention to key drivers is to consider both their importance (beta weights in regression) and how well the websites achieve the stated goal (top-box scores). The two key drivers with the most potential for improvement (high beta weights and low top-box scores) were the extent to which users feel excitement when shopping on the websites (average top-box score: 31%) and the ease of finding exactly what they want (average top-box score: 38%). For excitement, the leader was Anthropologie (Old Navy lagging). For finding “exactly what I want,” the leader was Nordstrom (Urban Outfitters lagging).
- Top frustrations were products out of stock, sizing issues, and slow loading. The most reported issue, affecting all websites, was products being out of stock, either entirely or for certain sizes. Some users reported not being notified of this until they were checking out. For nine of the websites, users reported issues with sizing (e.g., poor fit, missing sizes) and slow website loading (e.g., many large images and videos). Navigation/browsing issues were also common, affecting ten of the sites.
- Online clothes shoppers have trouble getting exactly what they want. Quantitative and qualitative signals from our findings point in the same direction: users of these clothing websites have trouble getting exactly what they want. Quantitative signals include difficult navigation/browsing, hard to find brands quickly, lack of trust in product recommendations, difficult returns, and inaccurate size guides. The qualitative “why” behind the numbers includes annoyance of products being out of stock, fit/sizing uncertainty, slow loading times, and various navigation/browsing issues. Considering both quantitative and qualitative findings, websites that would especially benefit from a focus on the UX of their websites are Urban Outfitters, Old Navy, Zara, and H&M.
For more details, see the downloadable report.