 The Net Promoter Score (NPS) is a popular business metric used to track customer loyalty. It uses a single likelihood-to-recommend (LTR) question (“How likely is it that you will recommend our company to a friend or colleague?”) with 11 scale steps from 0 (Not at all likely) to 10 (Extremely likely).
In NPS terminology, respondents who select 9 or 10 on the LTR question are “Promoters”; those who select 0 through 6 are “Detractors”; all others are “Passives.” The NPS is the percentage of Promoters minus the percentage of Detractors (the “net” in “Net Promoter”).
Despite some criticism in the UX community, research has shown that the NPS often has a strong relationship to company growth and actual recommendation behavior.
We recently described three methods for computing confidence intervals for NPS:
- Adjusted-Wald: Add a constant of 3 to the sample size (n), ¾ to the number of detractors, and ¾ to the number of promoters, and then compute the interval using a standard error based on the variance of the difference in two proportions.
- Trinomial means: Assign -1 to detractors, 0 to passives, and +1 to promoters. Compute the interval using a standard error based on the mean of these scores.
- Bootstrapping: Assign −1 to detractors, 0 to passives, and +1 to promoters. With at least 1,000 iterations, draw with replacement a random sample from the data with a sample size equal to the original dataset. Compute the mean for each iteration and store it in an array. Sort the array and determine the endpoints of the confidence interval such that the percentage of means included in the confidence interval matches the desired level of confidence with equal percentages excluded in each tail of the distribution.
In the two real-world NPS datasets we used to evaluate these three methods, our results were consistent with those of research published in The American Statistician (Rocks, 2016), which found the adjusted-Wald to be the best performing method.
Although our initial results were promising, we wanted to (1) extend our research to a collection of NPS datasets with a broader range of real-world NPS values and sample sizes, and (2) investigate the coverage properties of the adjusted-Wald over a broader range of sample sizes and levels of confidence.
If with these more extensive analyses the adjusted-Wald continued to be more precise AND had accurate coverage, we would be comfortable recommending it as the preferred method for constructing NPS confidence intervals in UX research practice.
Study 1: Comparison of the Three Methods
The Datasets
Every two years we research selected business and consumer software, most recently in 2020. As part of that research, we collected LTR ratings and computed the NPS for each product. Table 1 shows the sample sizes (n), NPS, and the number of promoters, passives, and detractors for 17 of the most recently evaluated consumer products. The NPS for the products ranged from −53% to 43%, and the sample sizes ranged from 29 to 111. We organized the products into three groups based on their sample sizes (small: 29–35; medium: 49–50; and large: 101–111).
| Product | n | NPS | Promoters | Passives | Detractors |
|---|---|---|---|---|---|
| Video Editor A | 35 | 9% | 11 | 16 | 8 |
| Language App | 35 | 23% | 16 | 11 | 8 |
| Tax Prep | 29 | 21% | 14 | 7 | 8 |
| Music Service A | 33 | 0% | 13 | 7 | 13 |
| Video Editor B | 30 | −3% | 9 | 11 | 10 |
| Email A | 31 | −42% | 6 | 6 | 19 |
| Music Service B | 50 | 18% | 22 | 15 | 13 |
| Browser A | 49 | 43% | 29 | 12 | 8 |
| Finance App | 50 | −8% | 13 | 20 | 17 |
| PDF Program | 50 | 10% | 19 | 17 | 14 |
| Email B | 49 | −53% | 7 | 9 | 33 |
| Browser B | 111 | 13% | 46 | 33 | 32 |
| App Suite A | 101 | 39% | 53 | 34 | 14 |
| Email C | 107 | 42% | 61 | 30 | 16 |
| App Suite B | 108 | 23% | 47 | 39 | 22 |
| Slides App | 102 | 18% | 48 | 24 | 30 |
| Word Processor | 109 | 6% | 39 | 38 | 32 |
Table 1: Seventeen real-world NPS datasets.
Comparisons
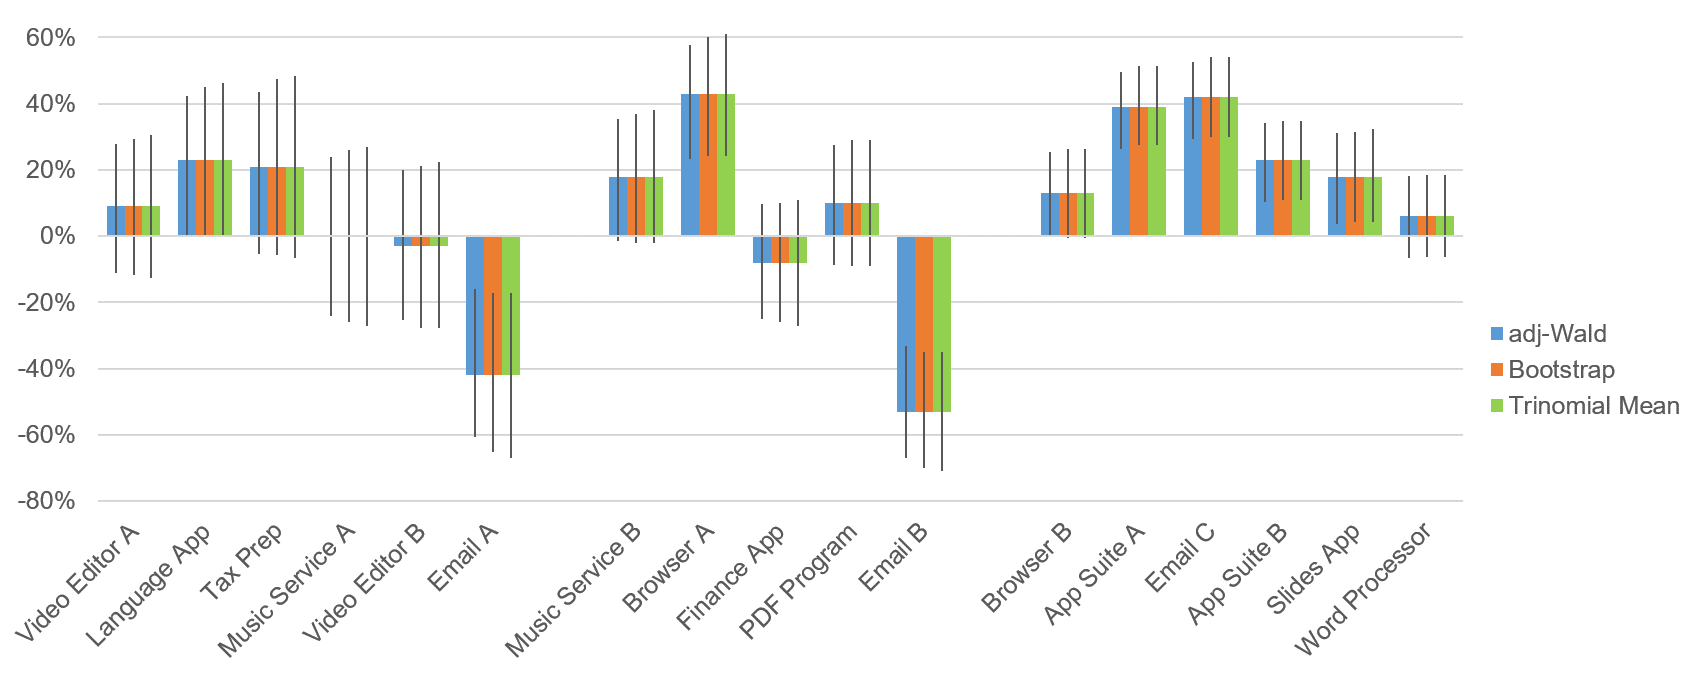
As is typical in our practice, we computed 90% confidence intervals for the 17 datasets using all three methods, with the results shown in Figure 1 and Table 2. A narrow interval is preferred to a wide interval because, all other things being equal, it’s more precise.
| 90% Confidence Interval Width | |||
|---|---|---|---|
| Product | Adj-Wald | Bootstrap | Trinomial Means |
| Video Editor A | 39% | 41% | 43% |
| Language App | 42% | 45% | 46% |
| Tax Prep | 49% | 53% | 55% |
| Music Service A | 48% | 52% | 54% |
| Video Editor B | 45% | 49% | 50% |
| Email A | 45% | 48% | 50% |
| Music Service B | 37% | 39% | 40% |
| Browser A | 35% | 36% | 37% |
| Finance App | 35% | 36% | 38% |
| PDF Program | 36% | 38% | 38% |
| Email B | 34% | 35% | 36% |
| Browser B | 25% | 27% | 27% |
| App Suite A | 23% | 24% | 24% |
| Email C | 23% | 24% | 24% |
| App Suite B | 24% | 24% | 24% |
| Slides App | 27% | 27% | 28% |
| Word Processor | 25% | 25% | 25% |
Table 2: Results for three methods of computing confidence intervals for the NPS.
Examination of Figure 1 and Table 2 shows that all three methods produced similar intervals, but for small and medium sample sizes (n = 29 to 50), the adjusted-Wald intervals were always narrower. When sample sizes were large (n > 100), adjusted-Wald intervals were as narrow as or narrower than the others.
Table 3 shows the average widths for each method and sample-size group. For small sample sizes, the adjusted-Wald method was on average of five points narrower than the trinomial means method and three points narrower than bootstrapping. The advantage of the adjusted-Wald was a bit less for medium sample sizes—three points narrower than the trinomial means method and two points narrower than bootstrapping. Once the sample sizes were larger than a hundred, there was no consistent difference among the methods.
| Sample Size | Adj-Wald | Bootstrap | Trinomial Means |
|---|---|---|---|
| Small | 45% | 48% | 50% |
| Medium | 35% | 37% | 38% |
| Large | 25% | 25% | 25% |
Table 3: Results averaged for the three sample-size groups.
Study 2: Coverage for the Adjusted-Wald Method
All other things being equal, narrower intervals are better. This statement is only true, however, when narrower intervals are accurate. One way to assess the accuracy of a method for constructing confidence intervals is to sample randomly with replacement from a dataset a large number of times. Then check to see whether the percentage of intervals that contain the target value matches the nominal level of confidence (in other words, whether the coverage is the same as the designated level of confidence.)
For this study, we sampled data from a very large real-world NPS dataset (n = 670) with an R program that computed the adjusted-Wald confidence interval for a given sample size and confidence level. We iterated each run of the program 10,000 times and assessed coverage for sample sizes from 25 to 500 and confidence from 80 to 99%.
As shown in Table 4, the observed coverage matched the nominal confidence interval in 26 of the 32 cells, and the absolute difference was never more than 1%. For example, at a sample size of 25, the adjusted-Wald method produced 90% confidence intervals that contained the actual NPS 89% of the time (1% below its advertised coverage). At 95% confidence the coverage was actually 96% (1% higher than its coverage target). In general, this performance is excellent, much better than many of the methods evaluated in Rocks (2016) or in our investigation of different ways to compute binomial confidence intervals (Sauro & Lewis, 2005).
| N | 80% | 90% | 95% | 99% |
|---|---|---|---|---|
| 25 | 80% | 89% | 96% | 99% |
| 50 | 80% | 91% | 95% | 99% |
| 75 | 80% | 90% | 95% | 99% |
| 100 | 79% | 90% | 95% | 99% |
| 200 | 80% | 90% | 95% | 99% |
| 300 | 80% | 90% | 95% | 99% |
| 400 | 79% | 90% | 95% | 99% |
| 500 | 79% | 90% | 95% | 99% |
Table 4: Coverage of adjusted-Wald confidence intervals for various sample sizes and levels of confidence rounded to the nearest percentage.
Summary and Discussion
We conducted two studies to evaluate the adjusted-Wald method for constructing NPS confidence intervals.
In the first study, we compared three methods for computing NPS confidence intervals: the adjusted-Wald, bootstrapping, and trinomial means. When sample sizes were small or medium (n = 29 to 50), the intervals were similar, but the adjusted-Wald consistently produced narrower (more precise) intervals. When sample sizes were large (n > 100), the interval widths were the same for all three methods.
These results supported using the adjusted-Wald method when computing confidence intervals for the NPS, but only if the adjusted-Wald method had accurate coverage. In a second study, we assessed its coverage with an independent large-sample NPS dataset (n = 670). The coverage was very accurate for sample sizes from 25 to 500 and confidence levels from 80 to 99%. In most cases it exactly matched the target confidence level; when it didn’t, the difference was never more than 1%.
Based on these results, we recommend that UX researchers who need a confidence interval for NPS use the adjusted-Wald method.