 Think Aloud (TA) usability testing is a popular UX research method.
Having participants speak their thoughts as they attempt tasks helps researchers understand sources of misunderstandings, potentially aiding them in identifying and fixing usability problems.
It’s such a common technique in usability testing that we suspect few researchers think about the impacts and consequences (positive or negative) of thinking aloud.
We have been investigating the effects of thinking aloud using data from several studies. We have found that thinking aloud tends to double the dropout rate and has little effect on study metrics, but, on average, it takes about 20% longer for participants to complete the same task while thinking aloud compared to a cohort of participants who aren’t asked to think aloud.
Our earlier investigations focused exclusively on unmoderated Think Aloud studies where there wasn’t any possibility of influence from a moderator. So why do people take longer to complete tasks when they think aloud? Is it because they are just reading the task or other text on a website? Or are they spending time reflecting on what they are doing and why they may be struggling?
As far as we know, there’s been no systematic effort to code what types of verbalizations come from TA studies, especially unmoderated ones. To come up with a method for coding what people say, we’ll return to some foundational work in thinking aloud.
While we take thinking aloud for granted today, up through the late 1970s, there was a reluctance to treat participant verbalizations as data. That changed in 1980 with the publication of Ericsson and Simon’s influential paper, “Verbal Reports as Data.”
Ericsson and Simon provided evidence that certain kinds of verbal reports could produce reliable data. They identified three levels of verbalization:
- Level 1: Verbalizations readily available in verbal form during task performance that does not require additional cognitive processing (e.g., reading written text aloud).
- Level 2: Verbalizations readily available in nonverbal form during task performance that requires no or minimal additional cognitive processing (e.g., participants describing their actions while performing a task).
- Level 3: Information not currently in the participant’s attention that requires substantial additional cognitive processing (e.g., participants are asked to report all perceived traffic hazards while they are driving a car; participants are asked to report feelings, motives, or explanations).
Level 3’s retrospective verbalizations can affect thought processes and behavior (famously demonstrated by Nisbett and Wilson in 1977), so Ericsson and Simon excluded them from their conception of TA. Interpreting Level 3 verbalizations as data can be risky, because, when asked by a moderator, people may feel obliged to provide an answer. In practice, however, most TA sessions include all three levels of verbalizations and, in moderated settings, other interactions with the moderator.
To help answer the question of what people say when they think aloud in an unmoderated remote usability study, we had a team of UX researchers analyze a set of participant videos to estimate how much time people spent producing Level 1, 2, and 3 verbalizations.
Study Details
To understand the types of verbalizations people make as they think aloud, we revisited the same source data used in our earlier article on TA versus non-TA task completion times. The source included ten studies with a mix of websites (e.g., United, Zillow, OpenTable) in which participants thought aloud while attempting a task. Before attempting tasks, TA participants viewed a short video with examples (primarily Level 2 and 3 verbalizations) of how to think aloud.
We selected videos from the ten studies to review and created a rubric to score the verbalizations as Level 1 (L1), Level 2 (L2), or Level 3 (L3).
Six MeasuringU researchers independently reviewed a training set of two videos using the rubric and logged the time participants spent in each of the levels. Times were then converted into percentages of the total video length and total time thinking aloud.
As is often the case with expert judgment, there was some disagreement regarding the total time spent thinking aloud and the amount allocated for each level. After the first video, the researchers met and identified discrepancies in how they interpreted the levels, often stemming from ambiguity in the levels described by Ericsson and Simon.
For example, do you count the pauses between utterances as part of the overall time or do you stop the time? And if a participant reads the text of a button or drop-down (e.g., I’m selecting Nov 9th) is that L1 (reading), L2 (participants describing their task actions), or both? The researchers refined the rubric to add the clarifications and updated their timings accordingly:
- If there is more than a “comma” level pause between utterances, then the audio segment is split.
- If a participant is reading text (L1) but also describing their actions (L2), log the segment as L2. For example, consider a participant saying, “Select the earliest flight; this is the earliest flight.” This would all be coded as L2 even though it started as L1.
- If a statement has both L2 and L3 components, it is L3. For example, a participant saying “I’m going to select this seat because I have to sit next to my spouse” is all L3 despite beginning at L2.
- “I guess” and “I think” are part of L2 even though they can be interpreted as having some explanatory L3 component.
- Good indicators of L3 are “because,” “so,” and “therefore.” For example:
- I guess this is the price breakdown SO I’ll take a look at it.”
- “It says here ‘Economy,’ THEREFORE, I’ll select this.”
Examples of L1, L2, and L3 verbalizations appear in Videos 1–3.
Video 1: Example of L1 verbalization (reading instructions).
Video 2: Example of L2 verbalization (speaking actions simultaneously with performing them).
Video 3: Example of L3 verbalization (explanation of confusion after performing a series of actions).
Study Results
A total of 27 videos were reviewed independently by the evaluators, with each video having between three and six researchers coding the same verbalizations. Overall, there were 336 coded verbalization times, 112 for each verbalization level.
The 27 videos had an average length of about five minutes (303 seconds). The average amount of total time thinking aloud coded per video was a bit less than 2 minutes (113 seconds). That means about 37% of task time contained some verbalizations.
Evaluator Agreement
To assess the agreement among evaluators, we paired up the time by level by video for each pair of evaluators. For example, five videos from one study on making a hotel reservation involved three evaluators coding the times for each level (Table 1).
| Video | Levels | Eval 1 Time | Eval 2 Time | Eval 3 Time |
|---|---|---|---|---|
| Hotel P1 | 1 | 00:04 | 00:06 | 00:17 |
| Hotel P1 | 2 | 00:32 | 00:39 | 00:18 |
| Hotel P1 | 3 | 00:27 | 00:23 | 00:34 |
| Hotel P2 | 1 | 00:00 | 00:05 | 00:18 |
| Hotel P2 | 2 | 00:54 | 00:36 | 00:32 |
| Hotel P2 | 3 | 00:00 | 00:05 | 00:00 |
| Hotel P3 | 1 | 00:13 | 00:20 | 00:27 |
| Hotel P3 | 2 | 00:50 | 00:52 | 00:52 |
| Hotel P3 | 3 | 00:04 | 00:11 | 00:11 |
| Hotel P4 | 1 | 00:07 | 00:22 | 00:24 |
| Hotel P4 | 2 | 01:11 | 00:55 | 00:52 |
| Hotel P4 | 3 | 00:01 | 00:13 | 00:16 |
| Hotel P5 | 1 | 00:12 | 00:10 | 00:19 |
| Hotel P5 | 2 | 00:27 | 00:47 | 00:30 |
| Hotel P5 | 3 | 00:07 | 00:04 | 00:03 |
Table 1: Sample of coded times from three evaluators (in minutes and seconds) for five videos from one hotel study. The average correlation (Fisher transformed) across all three pairs of evaluators in this sample of data is .86.
There was strong agreement among evaluators in the amount of coded time spent in each level. Table 2 shows the average correlation (Fisher transformed) between each pair of six evaluators across the entire dataset was r = .93. Correlations ranged from .55 to .99 between evaluators and from .78 to .99 across the pairs of evaluators.
| Evaluators Coding | ||
|---|---|---|
| 6 | ||
| 5 | ||
| 4 | ||
| 3 | ||
Table 2: Average correlation (Fisher transformed) between pairs of evaluators was high (r = .93).
Correlations will quantify disagreement but won’t necessarily identify evaluators who may be systematically lower or higher than others. As another check for consistency of evaluator judgment on the times coded, we looked at mean differences by level by video. Because not all evaluators reviewed all videos, we couldn’t do a simple comparison in the full dataset because some of the differences in means would come from a different number of evaluators observing different videos. To control for this imbalance, we focused on the 12 videos (Hotel/Restaurant) that had the same four evaluators.
We ran a repeated measures ANOVA on the evaluators’ measurements of the 12 videos and found statistically significant main effects of evaluator (F(3, 30) = 2.4, p = .08) and level (F(2, 20), p < .0001). There was also a significant interaction between evaluator and level (F(6, 60) = 5.4, p < .0001), suggesting that for some videos some evaluators differed in how much they coded. While this shows there is a statistically significant effect of evaluator, it’s dwarfed by the effect of different levels. The effect size (partial eta squared) for the main effect of levels (.70) was 3.5 times the effect size for the main effect of evaluators (.20).
Time in Each Verbalization Level
To estimate the percentage of time participants spent making each type of verbalization, we averaged the total time within each level across evaluators and then averaged across all 27 videos. For example, in one video from the United Airlines study that all six evaluators coded, the total time the participant spoke aloud was 108 seconds. The average time by level was 3% (3 seconds) in L1, 75% (81 seconds) in L2, and 22% (24 seconds) in L3. Figure 1 shows the average percentage of time spent in each level aggregated across all 27 videos.
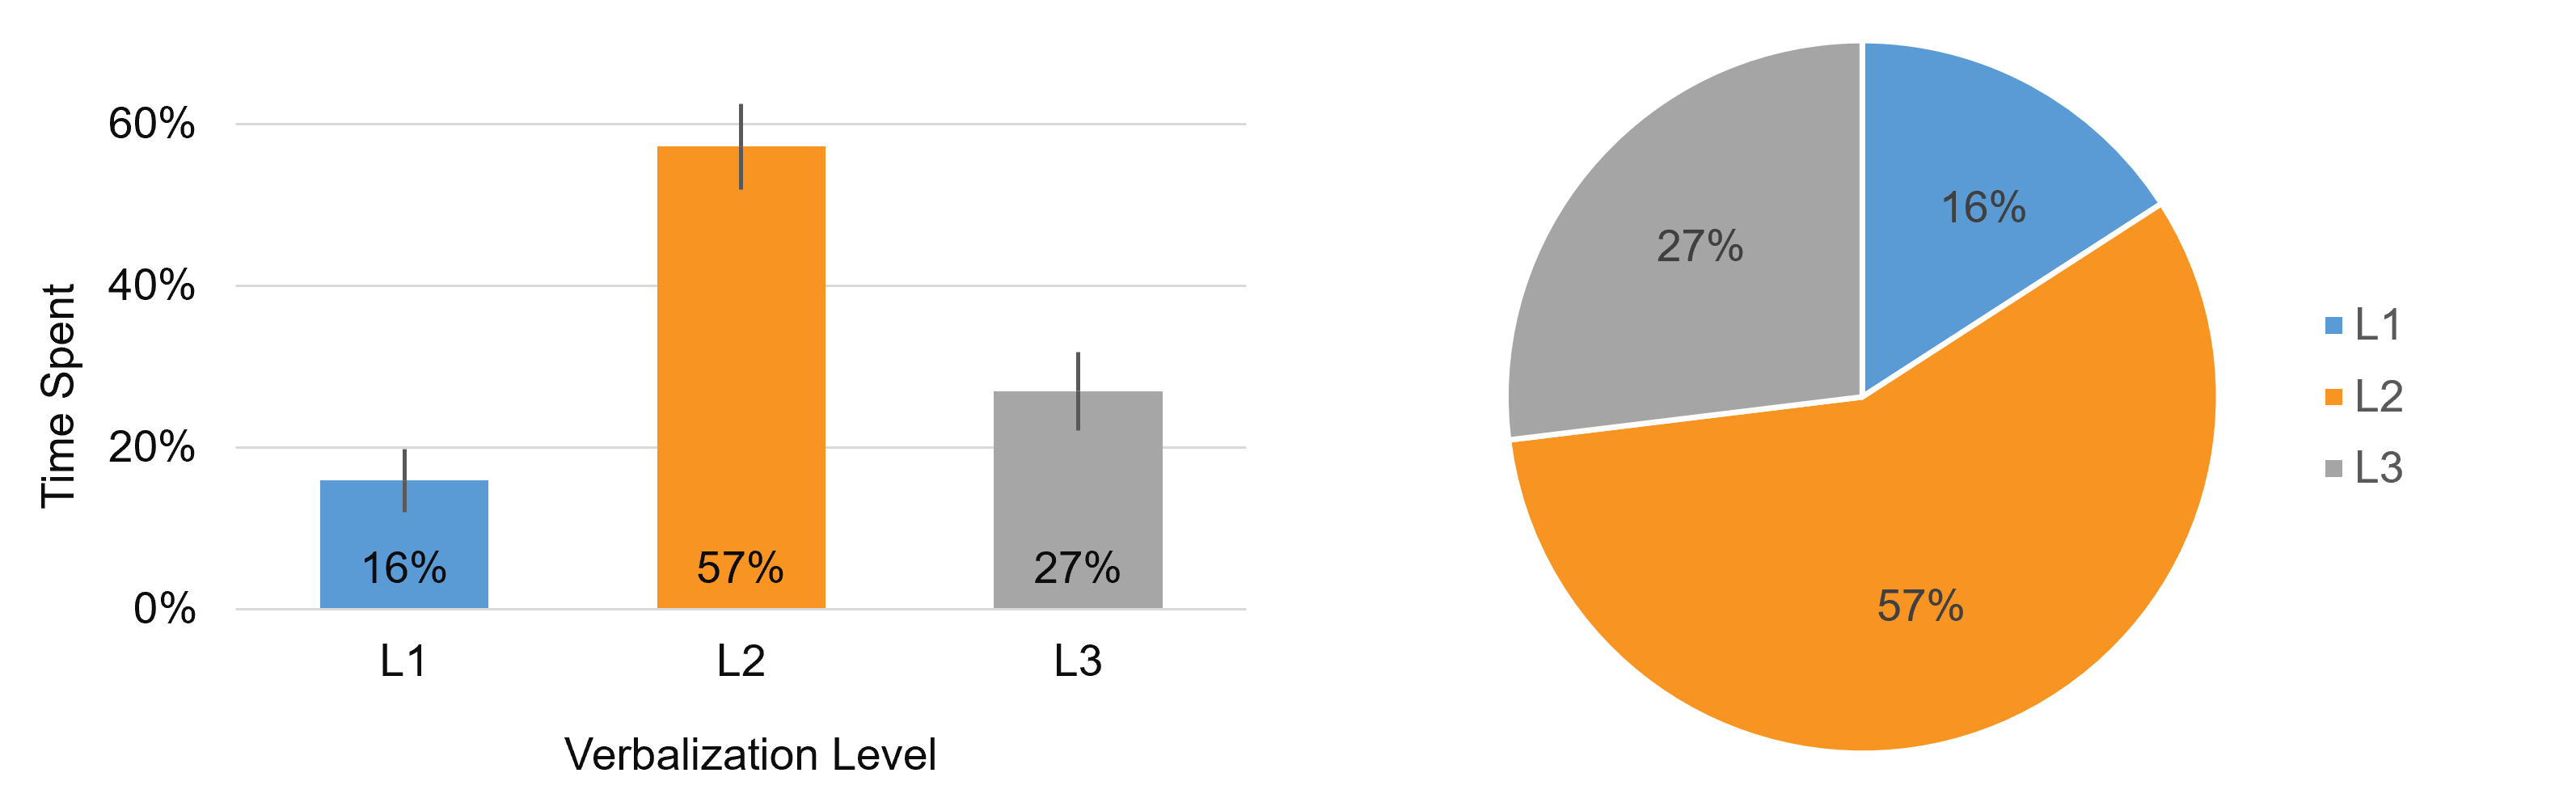
Most verbalization was spent in L2 (57%), with participants describing what they are doing as they do it. At least in this sample of videos, only 16% of the time was spent in L1, verbalizing the least helpful and diagnostic information of reading task instructions or text on the screen. About a quarter of the time was spent in more cognitively demanding L3 verbalizations (Table 3).
| Mean | Min | Max | |
|---|---|---|---|
| Level 1 | 16% | 0% | 38% |
| Level 2 | 57% | 38% | 90% |
| Level 3 | 27% | 3% | 58% |
Table 3: Mean, Min, and Max percentage of time spent in each level across the 27 videos.
How Each Verbalization Level May Contribute to Increased Task Times
The mean times spent in L1, L2, and L3 verbalizations may help to explain why people thinking aloud spent ~20% longer to complete tasks than those who were non-TA.
First, consider the L1 verbalizations. A recent meta-analysis of English reading speeds concluded that the average rate for silent reading is 238 words per minute, and for reading aloud is 183 words per minute, 23% slower compared to silent reading (Brysbaert, 2019). This means that the additional time due to reading aloud, relative to the mean task completion time of 303 seconds, is about 5 seconds (2% of the total).
The first step in getting to this estimate is to take 25% (cost of reading aloud) of the 16% of L1 verbalizations (Table 3), which is 4%. Of the mean total verbalization time of 113 seconds, 4% is about 5 seconds. Dividing 5 by the mean task completion time of 303 seconds is about 2%.
So, a reasonable estimate of the contribution of L1 verbalizations to the 20% difference between TA and non-TA is 2%, leaving 18% to be accounted for.
Next, consider L3 verbalizations. As demonstrated in Video 3, we expect that much of the L3 verbalizations took place while participants were verbalizing plans for upcoming actions or reflecting on past actions without doing anything to advance in the task. If we allocate all 27% of L3 verbalizations to the TA/non-TA difference, its contribution to the 20% difference is 11% (27% of 113 seconds is about 31 seconds, which is about 11% of the mean total verbalization time of 303 seconds).
The sum of the L1 and L3 verbalizations accounts for 13% of the additional time required to think aloud, leaving 7% unaccounted for.
What about L2 verbalizations? L2 verbalizations are a bit trickier to work with. As shown in Video 2, we expect that much of the time spent in L2 verbalization coincides with actions taken to advance in the task—participants are just saying what they’re doing while they do it. That said, it seems likely that actions done silently will either be the same speed or faster than actions taken while talking aloud, so this probably makes some unknown contribution to accounting for the difference in TA and non-TA task completion times.
If we assume that L2 verbalization only slows down participants by about 10% relative to non-TA (a total guess, but plausible), this accounts for another 2% (10% of the 57% for L2 verbalization from Table 1 is 5.7%; 5.7% of 113 seconds is about 6.4 seconds; 6.4 divided by 303 is about 2%).
With this admittedly somewhat shaky estimate, we’ve accounted for most (15%) of the increase in completion time for TA relative to non-TA, leaving 5% to explain.
How might we explain the remaining 5%? At this time, we can only speculate. With all the moving parts, it’s somewhat unrealistic to expect everything to add up perfectly due to variability, measurement error, and unknown factors. For example, some of the remaining differences could be due to differences in who chooses to participate in TA vs. non-TA studies given the difference in their dropout rates (TA dropout is double that for non-TA).
Summary and Discussion
A systematic review by multiple evaluators of 27 think-aloud videos found
A third of task time was spent thinking aloud. Across 27 videos the average amount of time spent thinking aloud was about a third of the overall time (113 out of 303 seconds).
L2 verbalizations accounted for most of the time talking. The bulk of the verbalizations involved L2 verbalizations describing actions as they were taken (“now I’m going to click on …”), which provide clues about intention but not the types of explanations associated with L3 verbalizations. Even though L2 verbalizations made up more than 50% of verbalization, they are less likely than L1 or L3 verbalizations to add to task completion time because L2 verbalization typically happens concurrently with the actions that participants take to complete tasks.
Participants produced a small amount of L3 verbalizations. Level 3 verbalizations represented a small amount of time (27% of verbalization time) with participants explaining their decisions (e.g., “I’m frustrated that I can’t seem to be able to sort the hotels by price …”). This amount of time would likely fluctuate more with the introduction of a moderator who might probe (even between tasks), possibly increasing the amount of L3 verbalizations. We may investigate this in a future analysis.
L1 verbalization accounted for the least amount of talk time. Participants spent the least amount of time reading text or task instructions. This is good, as it’s the least informative type of verbalization. In our study, we only recorded the time spent on the task (when MUIQ opens the task window). It’s likely if we recorded the pre-task text instructions then there would have been more time spent on this type of verbalizing (L1); however, this isn’t typically included in task time calculations.
Estimates of time spent in L1, L2, and L3 account for most of the additional time taken to complete TA tasks. Analysis of the percentages of time spent in the three levels accounts for most (15%) of the 20% increase observed for TA task completion time relative to non-TA.
Limitations
The instructional video may have influenced the times at each level. Participants viewed a 30-second video instructing them how to think aloud that mostly illustrated L2 and L3 descriptions (Table 4). This could have affected how much L2 and L3 verbalization was done, and a future investigation can assess how much the video influences the percentage of time verbalizing at each level.
| Level 1 | Level 2 | Level 3 | |
|---|---|---|---|
| Percentage | 10% | 40% | 50% |
| Time (mm:ss) | 00:03 | 00:12 | 00:15 |
Table 4: Time spent illustrating levels in the 30-second instructional video.
The percentage of time spent in each level might change for different types of tasks. For example, a task that requires more reading of detailed descriptions would generate more L1, and a more free-form exploratory task might generate more L3. Future analyses can investigate larger datasets with more task variation.