 If different researchers conduct a study, will they identify different problems?
While it was originally controversial, the evaluator effect is now well-established in the field of UX research. The evaluator effect is the finding that, in general, different teams or individuals conducting a usability study will identify and report different problems (Hertzum & Jacobsen, 2003). The extent to which this happens and the conditions that affect the magnitude of the evaluator effect are still topics of ongoing UX research.
The fewer controls there are between independent evaluators, the more likely different issues will be uncovered. Different methods (inspection versus usability testing), different tasks, different users, and evaluations of different parts of an interface will tend to uncover different issues. There is, however, some agreement on the likely magnitudes of the evaluator effect. For example, when little is controlled between evaluators, you can expect about 17% average agreement in problems found between independent evaluators.
Agreement increases as variables are controlled (same users, tasks, and methods). But even when everything is controlled, and different evaluators watch the same set of videos of participants interacting with a system, different problems surface.
In an earlier analysis, we systematically reviewed evaluator agreement in controlled studies and reported that the average agreement between evaluators was 59%. That is, on average, two evaluators generate problem lists that have 59% of the problems in common.
However, that average comes from only nine studies published in six sources. Of the nine data points, some had relatively small sample sizes. For example, three data points come from a paper by Vermeeren, van Kesteren, and Bekker (2003) in which they analyzed only five videos across three products with only two evaluators per product—providing little opportunity for disagreement. The average any-2 agreements for the three studies were relatively high (59%, 64%, and 75% respectively).
After publishing our earlier analysis, we reviewed another study by Hertzum, Jacobsen, and Molich (2014) that reported the results of CUE-9. In that study, ten evaluators coded problems from five unmoderated video sessions, and nine evaluators coded problems from watching five videos of moderated sessions. The participants in the video used the U-Haul website (uhaul.com) to price a move to Denver, Colorado in 2011. The authors reported an average any-2 agreement of 30% and 31% for the unmoderated and moderated groups respectively. Adding this to our existing set of studies raises the number of studies to 11 and shifts the overall average of any-2 agreement of controlled studies down from 59% to 48% (Figure 1).
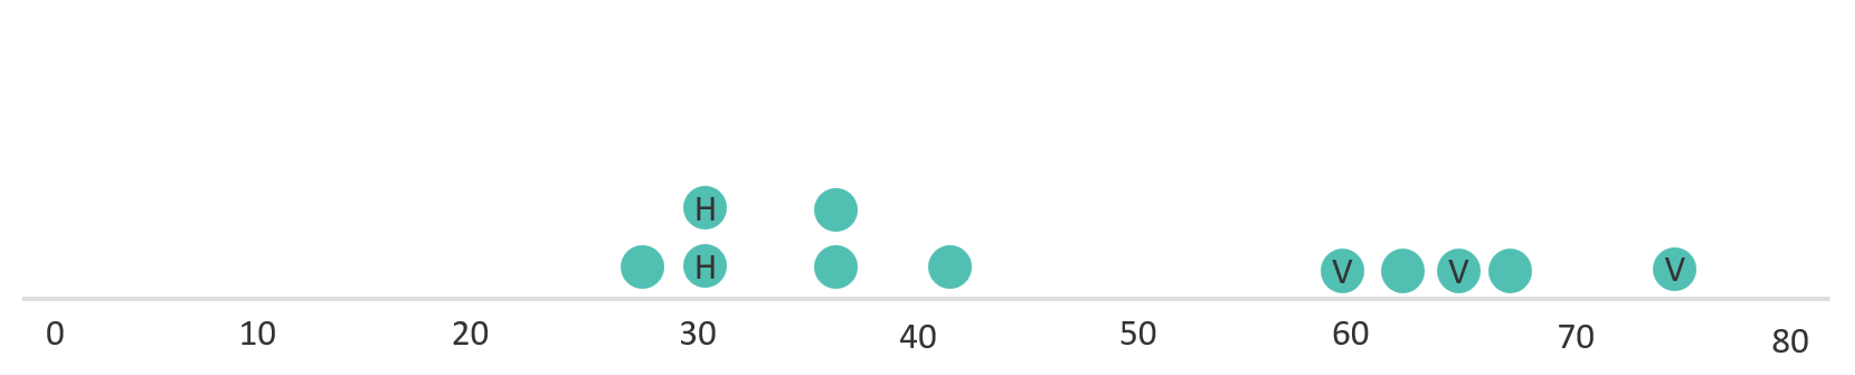
The large shift downward in the overall average suggests a need for more data. Not surprisingly, most UX research teams don’t have the luxury of having multiple people watch the same videos, much less publish the findings. Consequently, these datasets are rare. We wanted to add to the small number of published datasets using controlled studies (and to the only one we know of that included videos from unmoderated usability tests, which are becoming increasingly popular using platforms like MUIQ®).
Evaluation Study
We wanted our study design to emulate a common scenario with unmoderated usability studies: we would focus on speed and insights. As is typically done with rapidly moving product teams, researchers will watch videos collected from unmoderated studies, record notable events, and summarize them in a report for a product team to act on.
We had four researchers independently review 16 videos of participants thinking aloud while they completed a task on the United Airlines website (united.com). To keep the scenario loose (and we think ecologically valid), requirements were relatively minimal for the evaluators. We simply asked the evaluators to identify and code “issues and problems” for the videos in a spreadsheet. We provided no other guidance, such as what to focus on or what not to include (such as suggestions or recommendations). The videos were recorded during an earlier study in which we compared task metrics for think-aloud versus silent task completion.
The evaluators had varying degrees of experience with observing task-based videos and conducting usability studies themselves. Evaluator C had the least experience, having observed roughly one hundred sessions over six months before this study. Evaluator E had the most experience, having observed over ten thousand sessions over ten years. Evaluators D and Y both had observed 500+ sessions over one or two years.
Participants in the unmoderated usability study attempted one task while thinking aloud. They were asked to find a nonstop flight from Denver to LA. (It seems traveling to and from Denver is popular in our studies!) The participant videos had a median length of 7.7 minutes (times ranged from 3.5 to 16.6 minutes).
Issues were independently coded and described by each evaluator. Table 1 shows that the four evaluators identified 119 issue instances (between 22 and 35 identified by each evaluator).
| Evaluator | # of Issues |
|---|---|
| Y | 31 |
| E | 31 |
| C | 35 |
| D | 22 |
| Total | 119 |
Table 1: Number of problems/issues uncovered by each evaluator in a review of 16 videos.
The consolidation process followed a procedure like the one outlined in Molich and Dumas (2008). It is shown in Table 2 below.
Step 1: Combine issues within evaluators’ lists. Prior to consolidation, Evaluators Y and C reviewed the issues and identified 18 that were duplicate issues from the same evaluator, just phrased slightly differently. For example, “Unclear selected seat has an upcharge” and “Unclear there are extra fees for some seats” were in the same evaluator’s problem list. “Selects the departure date on the calendar when the user needed to select the return date” was a duplicate of “Selected return date when user meant to select departure date” for another evaluator. Both were combined as a date selection error before being added to the master list.
Step 2: Combine and consolidate issues across evaluators’ lists. Evaluators matched up the issues that were roughly the same, differing by only a few words (for example “unclear difference between economy options” and “unclear differences between the flight tiers/prices”).
They also matched issues they felt addressed the same problem. For example, evaluator D coded the issue “Filters reset after choosing first flight,” which was consolidated with evaluator E’s issue of “Filters set during departure flight selection are reset when the user moves to the return flight selection.”
An example of an issue that was similar and consolidated was evaluator C’s coding, “The travel insurance page is very cluttered, hard to find where to select no or yes options within the box,” and “Flight details in small dialog box on side of screen should be where the trip coverage message is.” These two issues were consolidated to reflect the overall clutter and lack of clarity of the travel insurance screen. The consolidation process resulted in 61 unique issues identified (next to last row of Table 2).
Step 3: Remove non-issues. Of the remaining non-matched issues, several included design suggestions and observations of participant actions that were not problems. For example, evaluator Y identified one participant who selected only one traveler at first but added a second traveler later in the booking process, completing the task successfully (not really a problem). As another example, evaluator C noted that the website design layout changed when the participant was asked about adding baggage (not clearly a problem). Twenty-three issues were removed in this step, leaving a total of 38 unique issues identified by the evaluators (last row of Table 2).
| Step | Issues Removed | Unique Issues Remaining |
|---|---|---|
| Original Set of Issues | 119 | |
| Removed Duplicates within the Same Evaluator | 18 | 101 |
| Combine and Consolidate Issues Across Evaluators Lists | 40 | 61 |
| Removed Observations and Suggestions | 23 | 38 |
Table 2: Problem consolidation across the steps, resulting in 38 unique issues.
Of the final set of 38 unique issues, roughly half of the issues (47%) were identified by only one evaluator. Seven (18%) were uncovered by all four evaluators, six (16%) by three, and seven (18%) by two (Table 3).
| # Evaluators Findings | % of Issues | # of Issues |
|---|---|---|
| 4 | 18% | 7 |
| 3 | 16% | 6 |
| 2 | 18% | 7 |
| 1 | 47% | 18 |
Table 3: Number and percentage of 38 unique issues found by one, two, three, or four of the evaluators.
Figure 2 shows the problems identified by each evaluator sorted by the most frequently occurring problems.

To assess the level of overlap we also calculated the any-2 agreement (Hertzum & Jacobsen, 2003) for the six pair-wise combinations of evaluators. The general formula for any-2 agreement is to divide the intersection (number of problems reported by both evaluators) by the union (number of problems reported by one evaluator plus the number reported by the other evaluator minus the intersection to avoid counting those problems twice). For example, evaluator Y reported 14 unique problems, evaluator C reported 17, and 10 of those problems were reported by both, so their any-2 agreement is 10 ∕ (14 + 17 − 10) = 10 ∕ 21 = 48%.
Table 4 shows the average any-2 agreement for each pair, which ranged from a low of 25% (Y and E) to a high of 48% (Y and C). The any-2 agreement averaged across all pairs of evaluators was 41%.
| Y | C | D | E | |
| Y | 14 | 48% | 40% | 25% |
| C | 10 | 17 | 46% | 43% |
| D | 10 | 12 | 21 | 42% |
| E | 8 | 13 | 14 | 26 |
Table 4: Any-2 agreement for the current study. The diagonal shows the number of issues identified by the indicated evaluator. The numbers below the diagonal are the number of issues in common for the pair of evaluators, and the percentages above the diagonal are the any-2 agreements between respective evaluators.
Summary and Discussion of the Evaluator Effect
Four evaluators independently reviewed 16 videos of participants attempting to book a flight on the United Airlines website in an unmoderated usability study. After reconciling problem lists, we identified 38 unique problems.
The average any-2 agreement was 41%. Among the four evaluators, any-2 agreement ranged from a low of 25% to a high of 48%. This average agreement was a bit higher than the study by Hertzum, Jacobsen, and Molich (2014), which had an average agreement of 31% for their unmoderated study.
Even after consolidating issues and removing insights, there was an evaluator effect. Why? We identified several reasons for discrepancies, like other studies of the evaluator effect.
Evaluators had no rubric. As intended, we didn’t provide the evaluators with an evaluation rubric on what to look for, what to report, and what not to include. Not surprisingly, this led to some disagreement as to what to report. Should you report design recommendations? As Hertzum and Jacobsen (2003) noted, vague evaluation procedures, vague problem criteria, and vague support for determining the goals against which to test a system lead to different problem sets.
Evaluators sometimes classified nonproblems as problems. As an extension of not having a rubric, some evaluators described issues that, after review, were determined to not be problems (e.g., minor inconvenience, design suggestion). For example, as shown in Figure 3, evaluator C coded the issue “Flight details in small dialog box on side of screen should be where the trip coverage message is.”
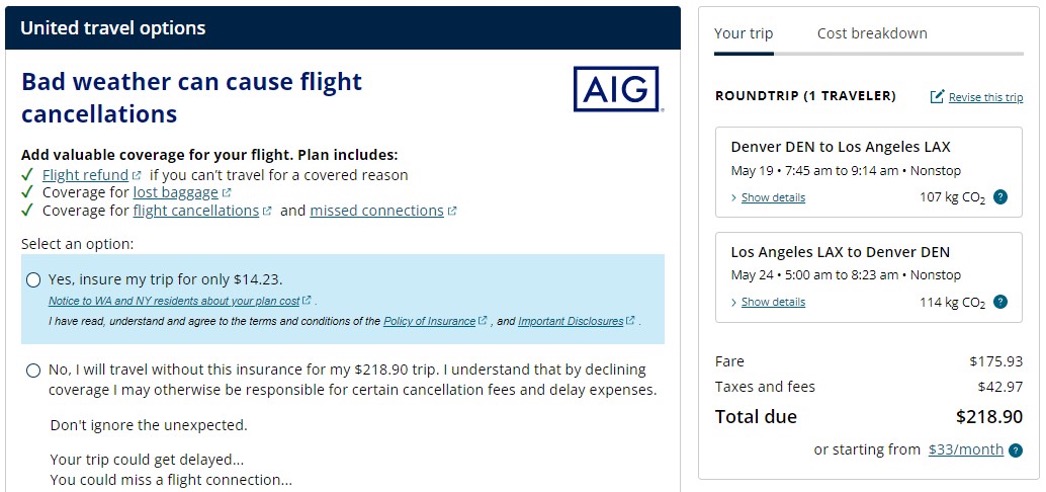
We suspect that making the insurance information prominent was an intentional design decision to promote generally profitable insurance at the expense of the clarity of a confirmation message, the lack of which may result in unintentional canceling or abandonment. But is this a bug or a feature? Interestingly, this same issue (promoting insurance) came up as a point of disagreement in prior CUE studies (e.g., CUE-8 discussion on requiring the damage waiver when renting a car).
Evaluators had problems with sticking to the task and with task ambiguity. Also related to the lack of a rubric, some evaluators were more focused on coding issues as they related to the task instructions versus a participant’s usability when interacting with the site. For example, in Video 1 a participant looks for a first-class seat. The class of seat (coach vs. first-class) wasn’t specified in the task description. If a participant looks for the cheapest first-class seat versus the cheapest coach seat, is that a usability problem?
Video 1: Participant looks for the cheapest first-class seat instead of the cheapest coach seat.
Granularity and matching decisions affect estimates of agreement. It’s easier to report instances of issues (problems that happened on a page) than to abstract them into a broader issue. Broadly described issues are more likely to generate agreement than more specific instances. While both may be helpful to a stakeholder, only broader issues will help agreement numbers. This is similar to the problem of matching discussed by Hornbæk and Frøkjær (2008).
Larger sample sizes increase opportunities for disagreement. The 16 participant videos observed made it one of the largest sample sizes used in research of this kind (e.g., Hertzum, Jacobsen, & Molich, 2014, used 5). Larger sample sizes of videos or evaluators increase the chance of uncovering issues, and with more issues come more opportunities for disagreement. This almost certainly lead to lower any-2 agreement rates in this study compared to the earlier averages (but it was still higher than some of the other studies in the literature).
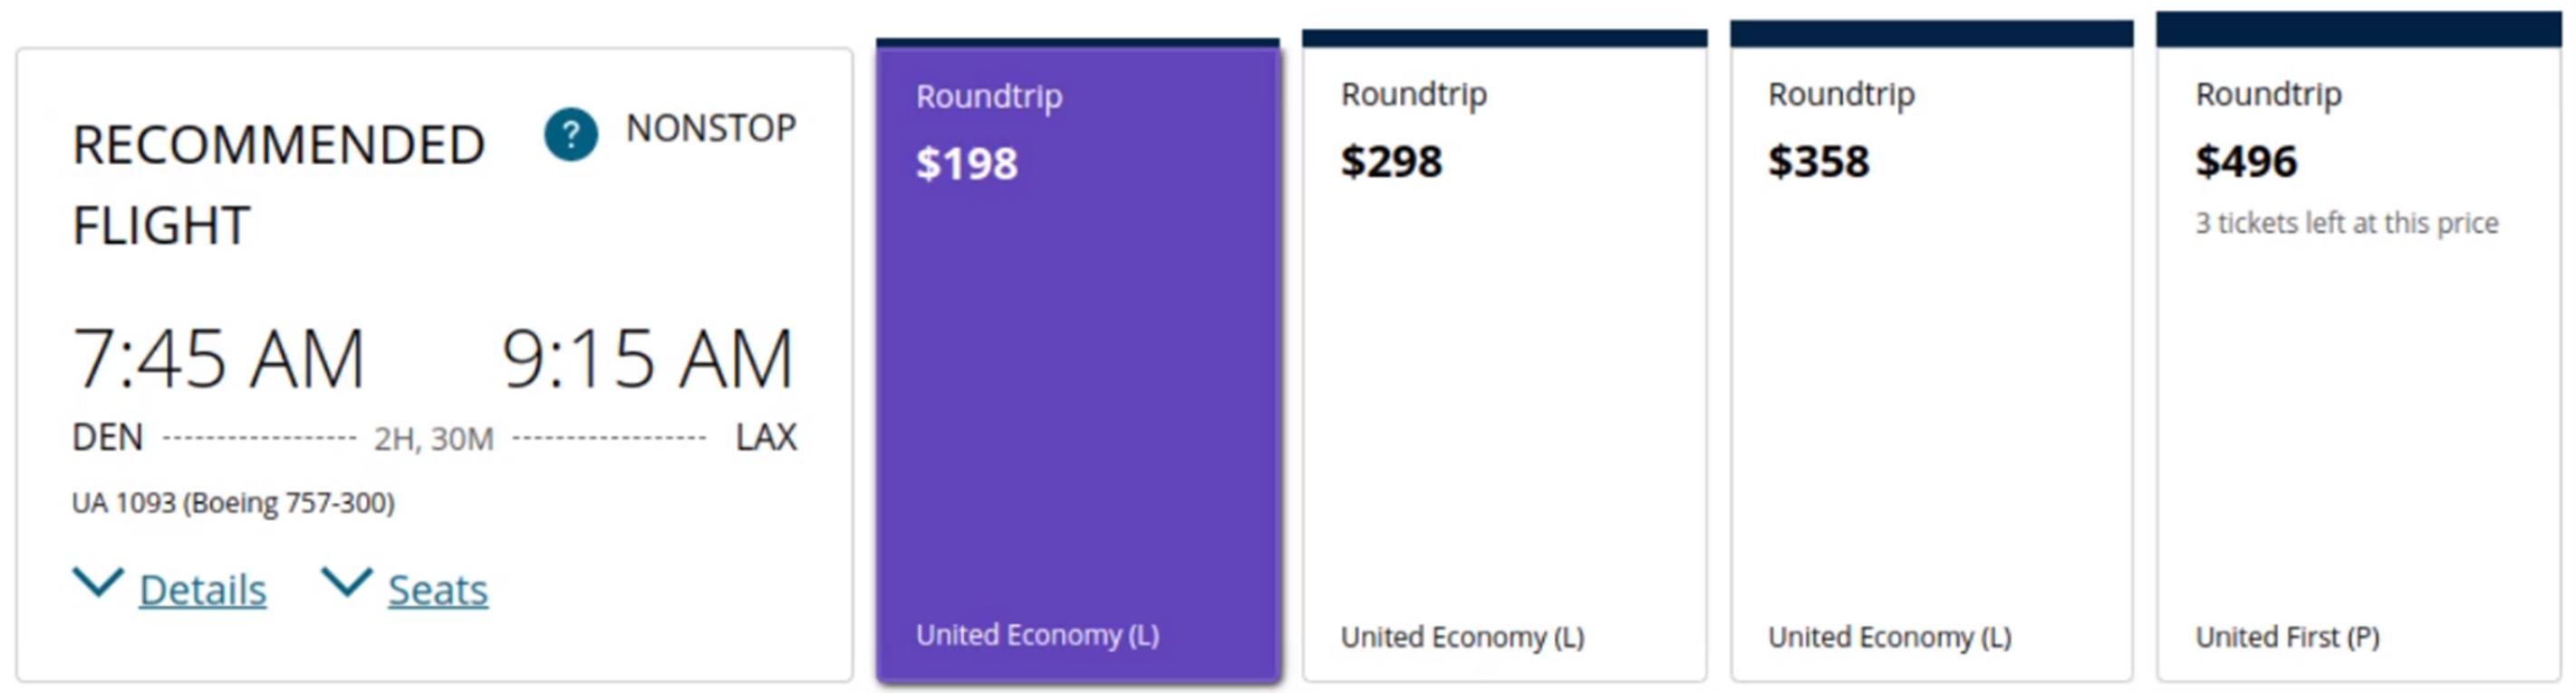
Evaluators sometimes assumed the role of the participant. Some evaluators coded issues based on their own confusion or pain points experienced while watching the participants complete the task (mixing expert reviews with usability testing). For example, evaluator C coded the issue “Unclear why certain flights are listed as ‘Recommended Flights’” (Figure 4). While this isn’t fully addressed on the website, no participants mentioned this as an issue. Instead, it’s a projection by the evaluator. It’s certainly something for a design team to consider but, strictly speaking, deviated from reporting an observed behavior or problem.
Dealing with observations and suggestions. In our evaluation, we decided to remove issues or suggestions that we considered not strictly usability issues observed from participant behavior. For example, Evaluator C recommended that a flight details dialog box should be located where the trip coverage message is (Figure 3). This is likely something a design team would want to hear (along with the rationale from the evaluator), but strictly speaking, it isn’t a problem encountered by a user. If we had not removed these observations and suggestions, the agreement rate would have dropped significantly (to about 36%).
Multiple evaluators add value. When possible, we recommend (and use in our research) multiple evaluators (at least two) to code and identify issues. The goal of most usability evaluations is not to achieve perfect agreement but to uncover problems that can be resolved. Often a variety of perspectives helps find more problems. This study reinforces the benefits of having multiple evaluators independently looking for issues. While you should expect disagreement on what is uncovered, the aggregated result will provide a more comprehensive assessment.
Unmoderated tests provide a cost-effective way to uncover problems. The Hertzum, Jacobsen, and Molich (2014) study found comparable problems (and disagreement) between teams watching a live participant to those observing recordings of unmoderated participants thinking aloud. They suggested that unmoderated testing could provide a cost-effective way to uncover problems quickly. In the almost ten years since their analysis was published, more options are available for collecting unmoderated TA recordings (such as the MUIQ platform used for this evaluation).


