 Uncovering usability problems is at the heart of usability testing.
Problems and insights can be uncovered from observing participants live in a usability lab, using heuristic evaluations, or watching videos of participants.
But if you change the person looking for the problems (the evaluator), do you get a different set of problems?
The Evaluator Effect
It’s been 20 years since two influential papers (Jacobsen, Hertzum, & John, 1998 and Molich, 1998) described what has now come to be known as the evaluator effect. This is the phenomenon by which different evaluators tend to uncover different issues. But how much disagreement is there?
In 1998, Rolf Molich conducted the first of his influential Comparative Usability Evaluations (CUE). The general format of the CUE study is that teams of researcher(s) work independently to evaluate an interface and come up with a list of usability problems. Molich generally found and extensively reported that what you get is what you see. Different evaluators tend to uncover different issues.
Rolf’s methodology has been criticized for lacking control over extraneous variables. For example, participants were generally free to use different methods, tasks, users, and sample sizes in most CUE studies. But this was, of course, part of Rolf’s point—you get different results because there is little agreement on how to uncover usability issues.
Rolf repeated his studies and added more controls (limit to usability tests, the same tasks, and even the same videos of participants). Generally though, the evaluator effect remained and others have replicated his findings. But how large of an effect is it?
To understand the extent of the evaluator effect, I reviewed the literature to understand how much disagreement existed between evaluators and identified some possible mitigating factors.
Measuring Agreement
To quantify the effect of agreement/disagreement between different evaluators, you need a measure. While many measures assess agreement (correlation coefficient, Kappa coefficient, chi-square test), they don’t necessarily work well for uncovering usability problems, especially with a varying number of evaluators involved. For example, a problem metric of Unique Problems uncovered isn’t ideal because as you increase the number of evaluators, you inflate the chances of more unique problems.
A “detection rate” metric of percent of total problems found by each evaluator also doesn’t work well because you never know the total number of usability problems in an interface, so the total number of discovered problems are used instead. But when there is only one evaluator, that evaluator will by definition always find 100% of the problems using this approach. With two evaluators, the lowest achievable detection rate is 50%, which occurs when both evaluators find only unique problems.
Consequently, the metric most commonly used in the literature is called any-2 agreement. It’s the percent of problems any two combinations of evaluators find in common divided by the total problems those two evaluators find. For example, in CUE-1 four teams were asked to evaluate a desktop calendar application. While 162 problems were uncovered, incredulously, only one problem was found by all four teams, as shown in Figure 1.
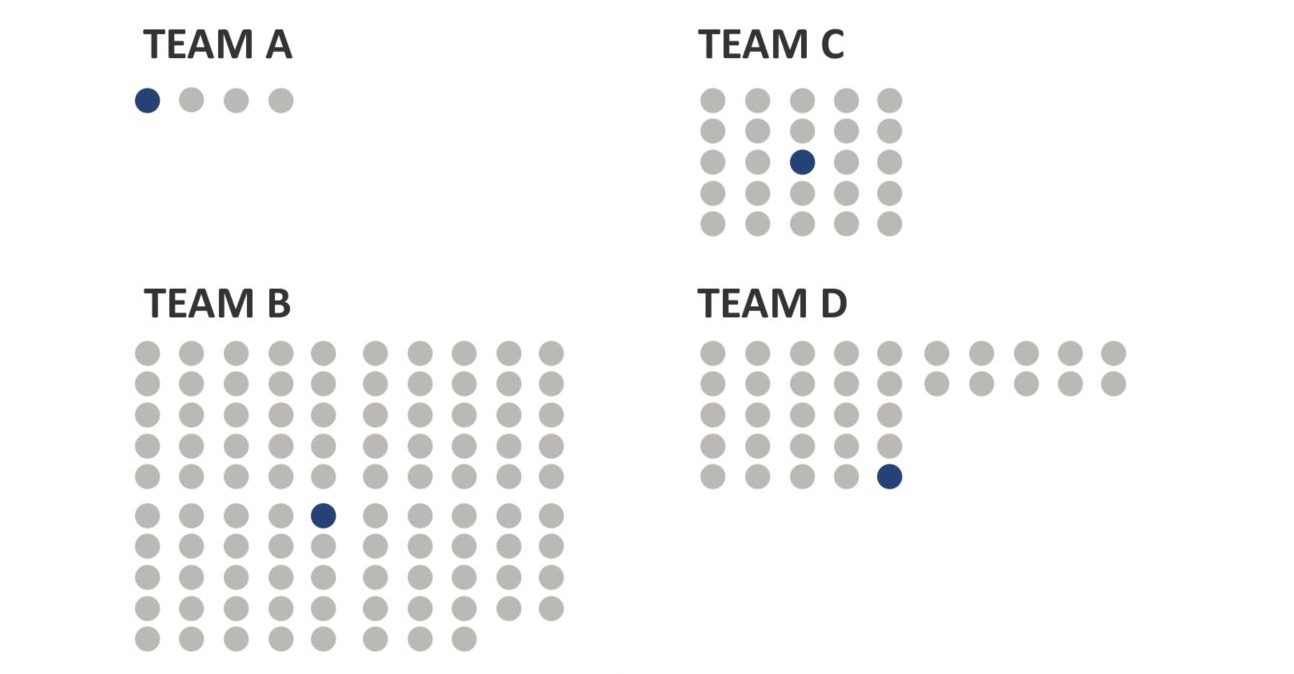
Figure 1: Only one of 162 problems was found by all four teams in CUE-1.
Any-2 agreement is the average of all combinations of pairs of the four teams. In this case, the result is 6 agreements averaged together. For example, teams A and B had two problems in common out of a total of 100 problems identified (102 minus 2 in common), making their agreement 2% (see Figure 2). Repeating this for all combinations of teams and averaging the results together generated an average any-2 agreement of about 4% for the CUE-1 study. Note that an earlier version of this article incorrectly had listed 102 problems instead of 100 problems.
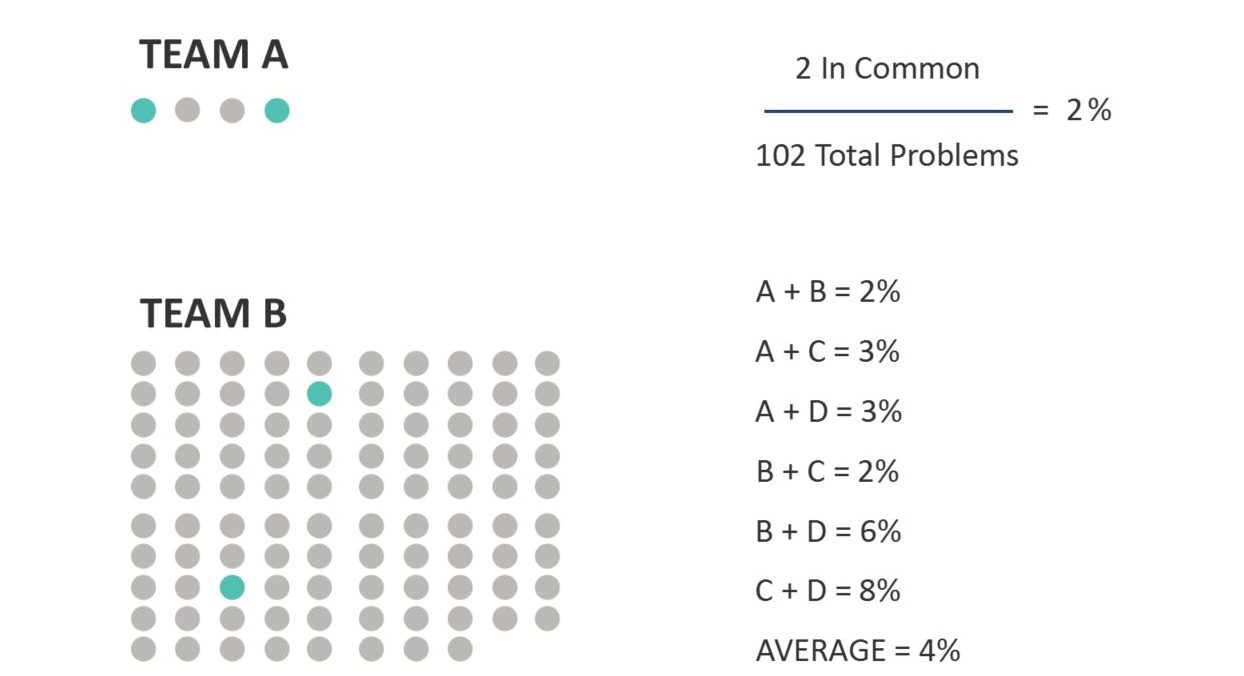
Figure 2: Calculating any-2 agreement between two teams from CUE-1.
Average Agreement Across Studies
I reviewed the usability literature (and some unpublished studies) going back decades to uncover studies that provided the any-2 agreement measure (or allowed me or another author to compute it from the data). I found 33 data points, with some duplicates from the same source. Table 1 displays the average any-2 agreement and the study (with a brief description).
Table 1: Average any-2 agreement from 33 studies found in the literature.
The median any-2 agreement across these 33 studies is 27%, ranging from a low of 4% to a high of 75%.
There’s a lot to read in these studies (so please let me know if you find a mistake or additional data). One reason for the spread is the diversity of their methodologies. The studies varied on one or more of the following methodological characteristics:
- Evaluation method: usability test and/or expert reviews
- Parts of the product: overlapping or non-overlapping functionality
- Participants: each observer watched the same or different participants
- Usability test tasks: all participants performed the same or different tasks
- Expert evaluators task: some studies specified the categories for the problems; others left that to the experts
Only one study (Molich and Dumas, 2008) provided a definition for how they determined when two problem statements described the same problem. In the other studies, those judging agreement (usually the authors of the paper) made this determination without describing the method. See Hornbaek & Frokjaer (2007) for a discussion of this problem description issue, which they called the matcher effect—a topic for a future article.
The original CUE study did have the lowest average any-2 agreement at only 4%, but it wasn’t too far off the other studies. In general, with little control of the methods, tasks, and definition of problems, expect evaluators to uncover about 27% of the same problems.
Controlled Studies
Six papers (which contributed 9 data points to Table 1) instituted more control in their studies, which increased the average any-2 agreement. The control implemented was different evaluators watching the exact same participants (live or video) interacting with an interface; they’re indicated in the “Control” column of Table 1:
- Jacobsen, Hertzum, & John, 1998; (1)
- Capra, 2006; (2)
- Kjeldskov et al., 2005; (1)
- Tullis Study 2, 2006, unpublished; (1)
- Vermeeren et al., 2003 (3)
- Andreasen et al., 2007 (1)
With evaluators watching the same participants, the average any-2 agreement increased to a median of 59% (ranging from 28% to 75%). Figure 3 shows the difference in the distribution of the average any-2 agreement between studies. The average difference is statistically significant (p < .05), using both the raw and log-transformed agreement rates.
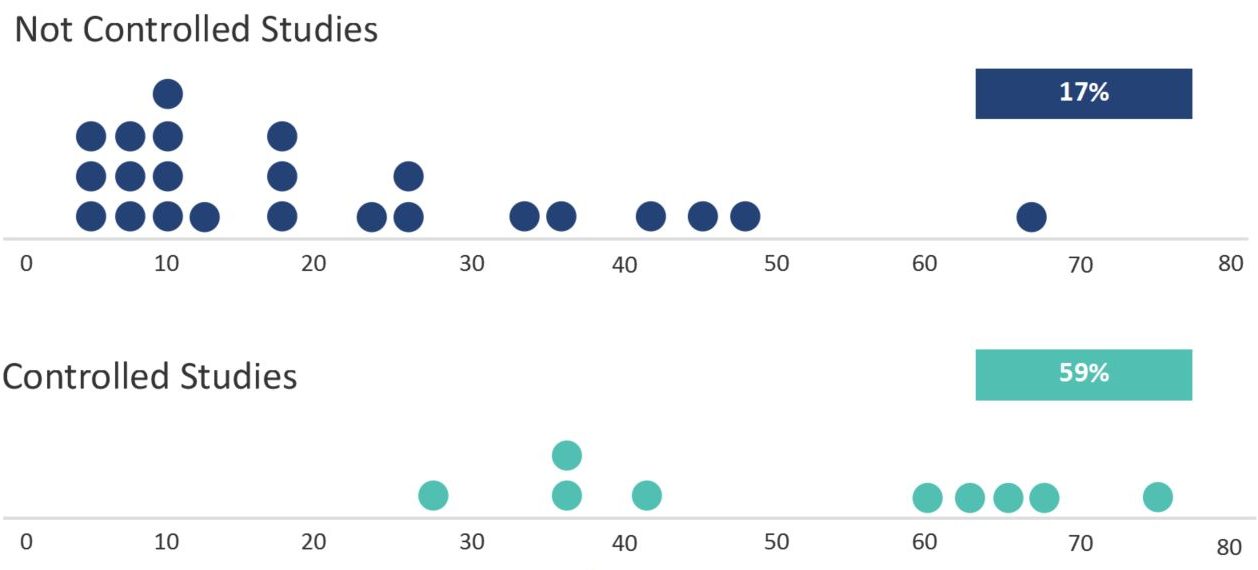
Figure 3: Difference in average any-2 agreement between not controlled and controlled studies (difference is statistically significant).
The controlled studies have an emphasis on internal validity whereas the uncontrolled studies emphasize external validity. Both types of studies illustrate the inherent variability involved in deriving problems from observing human behavior.
This distinction between types of studies becomes important when comparing usability expert agreement with that of other disciplines. Studies with high internal validity dominate the literature in other domains, so the more equitable comparison is with studies of usability expert agreement that have high internal validity. A topic for a future article of course!
Tom Tullis summed it up in his 2006 UPA unpublished proposal, which contributed two points to Table 1:
“The basic question that I was trying to answer with these two studies was simply, “If I ask one team of usability professionals to test a given website, would I get a significantly different set of issues if I asked a different team to do the test?”
The short answer to Tom’s question seems to be, yes, unless you control for methods, tasks, and participants, and even then you should expect about half the same problems to be uncovered.
Summary & Takeaways
A review of 33 studies that examined the evaluator effect found the following:
Any-2-agreement is a recommended way to measure overall agreement/disagreement between evaluators. It’s the percentage of problems found in common between two evaluators divided by the total number of problems found. This is averaged over every combination of evaluators in a study.
The average agreement between evaluators is 27%. This includes studies in this review that had little control in they collected data with different methods (usability testing with expert reviews), tasks, and participants. In other words, with little direction given, you should expect about 27% agreement (but it can range from 4% to 75%).
Controlled studies have higher agreement. By having evaluators watch the exact same participants (controlling for methods, tasks, functions), you can expect the agreement between evaluators to double to around 59%.
Agreement isn’t necessarily the goal. While the evaluator effect suggests some core UX methods are unreliable, agreement isn’t necessarily the only goal, if the goal at all. The goal of usability testing is ultimately a more usable experience. Diversity of perspective can be a strength. Using multiple evaluators in a study will leverage different perspectives and capture more problems.
Future work is needed. The evaluator effect is a large and somewhat controversial topic in UX. Continued analysis is needed, including: assessing agreement for only severe problems, other variables that lower agreement, the problem with “matching” problems, and comparing agreement rates to other industries when judgment is used.
Thanks to Jim Lewis and Joe Dumas for commenting on drafts of this article (some going back 10 years).