 In Think Aloud (TA) testing, participants speak their thoughts while attempting tasks. The process is meant to help researchers identify usability problems and potential fixes.
Indeed, in an earlier analysis, we found an increase in problem discovery. Our evaluation of 153 videos, split between TA and non-TA, revealed that evaluators uncovered 36–50% more problems with think-aloud tasks than silent task performance.
There are, however, some negative side effects of verbalizations. While it had little effect on study-level metrics such as the SUPR-Q® and UX-Lite®, we did find it:
- Doubles the dropout rate
- Increases task time by about 20%
- Impacts attitudinal data, such as perceptions of ease, at the task level
We’ve also discussed how a list of problems is affected by the judgment of the evaluators (the evaluator effect). When watching the same videos, independent evaluators tend to identify only around 30–50% of the same problems.
In an earlier analysis of the evaluator effect, we confirmed these numbers from a large-sample unmoderated study and found an average any-2 agreement of 41%. That was a result of four evaluators independently coding 16 videos of participants thinking aloud. In that analysis, 38 unique problems were found. Do verbalizations from participants impact agreement rates for evaluators?
In an analysis of 27 TA videos, we found that only about a third of the actual task time included verbalizations. The bulk of those verbalizations (50%) involved what has been called Level 2 verbalizations—participants describing actions as they were attempting a task. A smaller but still substantial percentage (27%) of the verbalizations involved participants explaining their decisions (called Level 3), which could potentially provide more insights into problems. Do these verbalizations help or hinder agreement? To find out, we conducted a follow-up study using participants who weren’t thinking aloud and report the results in this article.
Study Details Using Non-TA Videos
To compare the agreement rate for non-TA videos we followed a similar procedure as described in our earlier article on the evaluator effect.
In this new study, four researchers independently reviewed 24 videos (no sound) of participants attempting a task on the United Airlines website (united.com). The videos were not just TA videos with the sound removed. Study participants were not asked to think aloud, nor did they need to share their microphones or webcams.
As in the TA study, evaluators were simply asked to identify and code “issues and problems” for the videos in a spreadsheet. They were given no other guidance, such as what to focus on or what not to include (such as suggestions or recommendations). The videos were from an earlier study in which we compared task metrics for think aloud versus silent task completion. Therefore, the same evaluators were used in both the previous TA study and this study.
The evaluators had varying degrees of experience with observing task-based videos and conducting usability studies themselves. Evaluator C, with the least experience, had observed roughly 100 sessions over six months before this study. Evaluator E had the most experience, having observed more than 5,000 sessions over ten years of experience. Evaluators D and Y had one or two years of experience, each having observed 500+ sessions.
Participants in the study were asked to find a nonstop flight from Denver to LA. The videos had a median time of eight minutes (low of 3.3 and high of 14.3 minutes), similar to the TA videos that had a median length of 7.7 minutes (from 3.5 to 16.6 minutes).
Issues were independently coded and described by each evaluator. Table 1 shows the four evaluators identified 99 issues (between 11 and 37 identified by each evaluator).
| Evaluator | # Issues |
|---|---|
| Y | 30 |
| E | 21 |
| C | 37 |
| D | 11 |
| Total | 99 |
Problems were then consolidated using a procedure similar to the one outlined in Molich and Dumas (2008).
Step 1: Combine issues within evaluators’ lists. During consolidation, Evaluator Y reviewed the issues and removed duplicate issues coming from the same evaluator. While these issues were slightly different, they’re all rooted in the same overarching usability issue experienced by many participants. For example, Evaluator Y coded the issues “Re-selects the same flights after reaching the traveler information page” and “Doesn’t enter traveler information.” Both issues are rooted in the fact that participants expected to have selected their seats sooner in the process and are confused when they’re able to progress further without doing so.
Step 2: Remove observations and suggestions. Of the remaining non-matched issues, several included design suggestions and observations of participant actions that were not clearly problems. For example, Evaluator C coded the issue “The options on the bundles page are different” after one traveler was shown different add-on promotions than another traveler. While this might be confusing across multiple bookings, it’s not actually a usability issue, as these promotions are intentionally based on the seat type the traveler selects beforehand.
Step 3: Combine and consolidate issues across evaluators’ lists. Evaluator Y matched the issues that were roughly the same, differing by only a few words (for example, “Switching between flight filters doesn’t work—filter doesn’t apply after selecting new one” and “Filters reset after choosing first flight”). This was done both within and across evaluator lists. The consolidation process resulted in 29 unique issues identified (last row of Table 2).
Despite the higher number of videos, nine fewer problems were found than in our TA study of united.com (which had 38 unique problems in 16 videos).
| Step | Issues Removed | Unique Issues Remaining |
|---|---|---|
| Original Set of Issues | 99 | |
| Removed Duplicates within the Same Evaluator | 5 | 94 |
| Removed Observations and Suggestions | 36 | 58 |
| Combined and Consolidated Issues Across Evaluators’ Lists | 29 | 29 |
Of the final set of 29 unique issues, roughly half (48%) were identified by only one evaluator. Four (14%) were uncovered by all four evaluators, 14% by three, and 24% by two (Table 3).
| # Evaluators | ||
|---|---|---|
| Finding | % of Issues | # of Issues |
| 4 | 14% | 4 |
| 3 | 14% | 4 |
| 2 | 24% | 7 |
| 1 | 48% | 14 |
Figure 1 shows the problems identified by each evaluator sorted by the most frequently occurring problems.

To assess the level of overlap, we also calculated the any-2 agreement (Hertzum & Jacobsen, 2003) for the six pair-wise combinations of evaluators. The general formula for any-2 agreement is to divide the intersection (number of problems reported by both evaluators) by the union (number of problems reported by one evaluator plus the number reported by the other evaluator minus the intersection to avoid counting those problems twice). For example, Evaluator Y reported ten unique problems, Evaluator C reported sixteen, and eight problems were reported by both, so their any-2 agreement is 8/(10 + 16 − 8) = 8/18 = 44%.
Table 4 shows the average any-2 agreement for each pair, which ranged from a low of 25% (Y and D, D and E) to a high of 44% (Y and C). The any-2 agreement averaged across all pairs of evaluators was 34%.
| Y | C | D | E | |
| Y | 10 | 44% | 25% | 43% |
| C | 8 | 16 | 30% | 38% |
| D | 4 | 6 | 10 | 25% |
| E | 9 | 10 | 6 | 20 |
Comparing Non-TA with TA Results
We were interested in (1) comparing measurements of evaluator agreement between the current non-TA and previous TA results and (2) understanding the extent of discovery overlap for the two studies.
Evaluator Agreement
Table 5 shows the percentages of issues uncovered by the four evaluators who reviewed the non-TA in this study compared to the percentages of issues uncovered in the previous TA study. Roughly the same percentage of issues in the two studies were uncovered by all four evaluators (14% non-TA, 18% TA) and single evaluators (48% non-TA, 47% TA).
| # Evaluators Finding | % of Issues non-TA | % of Issues TA |
|---|---|---|
| 4 | 14% | 18% |
| 3 | 14% | 16% |
| 2 | 24% | 18% |
| 1 | 48% | 47% |
Consistent with these percentages, the mean any-2 agreement percentages in the studies were similar; TA was nominally higher (non-TA: 34%, TA: 41%). The non-TA any-2 agreement was comparable to a study by Hertzum et al. (2014), which had an average agreement of 31% for their unmoderated study.
Discovery Overlap
Although these 24 videos were different from the 16 used in the TA study, we did expect there to be an overlap in problems found as participants were all attempting the same task.
Evaluator Y combined the 38 issues uncovered in the TA study with the 29 uncovered in the non-TA study (67 total issues) to look for overlapping issues. Figure 2 shows the overlap in issues between methods. Around a third (31%) of the issues were uncovered in both methods, with TA having 17 issues non-TA didn’t have and non-TA having 8 issues not uncovered from the TA videos.
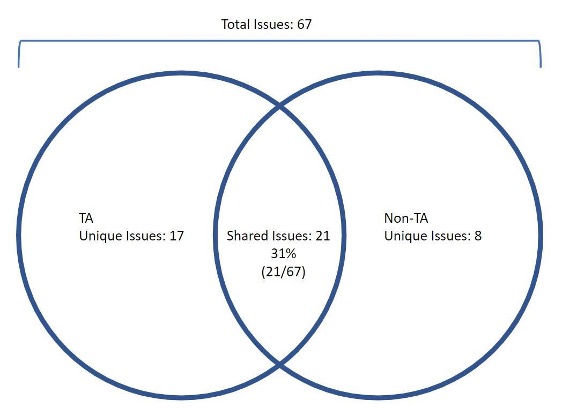
This analysis indicates that even though there was no significant difference in evaluator agreement between non-TA and TA lists of usability issues, an evaluation of the 16 TA videos uncovered significantly more unique issues than evaluation of the 24 non-TA videos (non-TA: 8/67 = 12%, TA: 17/67 = 25%, N−1 Two-Proportion Test Z = 1.99, p = .05).
This result is consistent with the reasoning that verbalizations from participants during TA usability studies can signal evaluators to the occurrence of a usability issue and with our earlier research comparing problem discovery with TA and non-TA methods.
For example, Video 1 illustrates how the participant’s comment, “Which one am I selecting for? Oh, I just selected for Los Angeles,” indicates confusion about which flight for which the seat selection is being made. This added context certainly seems like it made it easier for evaluators to identify the issue. However, even with this verbalization, only two of the four evaluators considered this a problem. So there was some agreement, but not for all evaluators, suggesting that TA itself doesn’t necessarily eliminate the evaluator effect.
Video 1: User confusion about the flight for which he has just selected seats.
Summary and Discussion
Our analysis of the evaluator effect comparing non-TA to TA videos revealed:
Agreement was nominally higher in TA. The average any-2 agreement was higher for TA than non-TA using the same evaluators (41% vs. 34%), and slightly (not statistically) more problems were uncovered by all four evaluators in TA than non-TA (18% vs. 14%).
Evaluators reviewed more non-TA videos but found fewer problems. There were 24 non-TA videos coded independently by the four evaluators in this study compared to 16 for the TA analysis (50% more). More videos will increase the chance of new problems, and more problems increase the chance of disagreement. However, the total number of unique problems uncovered was lower for non-TA than TA (29 vs. 38), which builds on the findings of our earlier analysis that showed TA studies tended to uncover more.
TA might increase evaluator agreement, but the current evidence is weak. We can’t over-generalize the findings from one dataset, but this analysis puts TA on the better side of agreement. That is, if these findings had revealed better agreement for non-TA videos, the case that TA helps evaluators better understand and agree upon issues would be weak. Future analysis is certainly needed to understand if TA consistently improves agreement.
TA led to the discovery of more unique usability issues. Analysis of the overlap in problem discovery for TA and non-TA found significantly more unique issues uncovered with TA. This is consistent with the reasoning that participant verbalizations in TA usability studies can reveal otherwise undiscovered usability issues. See our earlier analysis of these same TA and non-TA videos, which found that TA videos generated 36–50% more problems.