 In a previous article, we described three ways to estimate SUS scores from UX-Lite™ (and UMUX-Lite) scores, using either both items (perceived measures of Ease and Usefulness) or the Ease item only:
- Two-item interpolation: Scaling the mean of both items to a 100-point scale (Lite).
- One-item interpolation: Scaling just the Ease item to a 100-point scale (EaseInt100)
- One-item regression: Using a regression equation derived from just the Ease item (EaseReg100).
The first approach is the standard way to compute UMUX-Lite and UX-Lite scores from Ease and Usefulness scores. The second approach (EaseInt100) uses interpolation to rescale the Ease item to a 0–100-point scale. The third approach (EaseReg100) uses a regression equation to predict overall SUS means from the means of its Ease item.
Although the historical approach to estimating SUS from UMUX-derived metrics has been to use the first approach to compare UMUX-Lite with SUS, it is possible (and theoretically satisfying) that estimation using just the Ease item (interpolation or regression) may be as or more accurate.
In this article, we apply these three approaches to two sets of data to see which of them most accurately estimates concurrently collected SUS scores. One set is based on nine published UMUX-Lite means, and the other is based on 100 UX-Lite studies conducted at MeasuringU®.
Data Set 1: Nine UMUX-Lite Studies
In the paper that introduced the UMUX-Lite (Lewis et al., 2013), the mean difference for the SUS minus the UMUX-Lite was about 3.5 points. This led the authors to propose a regression equation to bring the metrics into closer correspondence, but over time that regression was found to seriously underestimate the SUS at higher levels of perceived usability (Lah, Lewis, & Šumak, 2020), so we do not recommend its use.
The most recent summary of correspondence between UMUX-Lite and SUS (Lah et al., 2020, Table 9) found the mean difference from 16 published comparisons for SUS minus UMUX-Lite was −0.4, less than half a point on the 0–100-point scale.
For a number of these comparisons, however, Ease data is not available. The results for nine relatively recent comparisons from 2018 through 2020 for which we have Ease data are listed in Table 1:
| Study | n | SUS | LiteDiff | EaseIntDiff | EaseRegDiff |
|---|---|---|---|---|---|
| Auto Insurance | 245 | 77.8 | −2.42 | −0.02 | 1.10 |
| Notes | 541 | 56.6 | −2.54 | 2.67 | −1.75 |
| PowerPoint | 473 | 70.9 | −3.45 | 2.46 | 1.39 |
| Gmail (Slovene) | 395 | 79.3 | −1.93 | −2.73 | −0.65 |
| Amazon | 338 | 84.8 | −1.86 | 0.31 | 2.97 |
| Excel | 390 | 69.6 | −4.37 | 3.35 | 1.79 |
| Gmail (English) | 256 | 78.0 | 0.30 | 1.02 | 1.93 |
| Word | 453 | 75.5 | −2.54 | 1.56 | 1.77 |
| Office Systems | 746 | 63.6 | −3.26 | −0.25 | −2.37 |
| Mean | −2.5 | 0.9 | 0.7 | ||
| Upper95 | −1.5 | 2.4 | 2.1 | ||
| Lower95 | −3.5 | −0.5 | −0.7 |
Table 1: Mean differences with 95% confidence intervals between observed SUS means and three estimates of SUS from concurrently collected UMUX-Lite means (LiteDiff = SUS − UMUX-Lite; EaseIntDiff = SUS − EaseInt100; EaseRegDiff = SUS − EaseReg100).
The accuracy of estimation using the UMUX-Lite for this subset of recent studies is significantly poorer than the Lah et al. (2020) estimates (a -2.5 difference vs. a -0.4 difference). We do not have a compelling hypothesis for why this is the case, but the numbers are what the numbers are. A change like this is almost certainly exacerbated by the relatively small sample of studies included in the UMUX-Lite meta-analyses.
The more interesting finding is that estimation of SUS from the UMUX-Lite Ease item was very accurate for both interpolation (EaseInt100: a 0.9-point difference) and regression (EaseReg100: a 0.7-point difference). The confidence intervals for these metrics included 0 (so the null hypothesis can’t be rejected), and the endpoints of the limits indicate that differences for these metrics greater than, respectively, 2.4 and 2.1 are implausible.
Data Set 2: 100 Unpublished MeasuringU UX-Lite Studies
Since 2017, we’ve used the UX-Lite Usefulness item alongside the SUS in assessing 100 websites/products. Table 2 displays nine of those assessments.
| Product/Study | n | SUS | LiteDiff | EaseIntDiff | EaseRegDiff |
|---|---|---|---|---|---|
| Dropbox | 63 | 77.7 | −3.4 | −1.7 | −0.2 |
| PowerPoint | 104 | 70.8 | −7.4 | −2.9 | −2.7 |
| iTunes | 30 | 72.2 | −1.5 | 1.3 | 0.8 |
| McAfee Antivirus | 31 | 72.0 | −1.4 | −2.2 | −1.9 |
| Google Chrome | 50 | 75.9 | 3.9 | −2.1 | −0.9 |
| Mint | 50 | 75.2 | −1.8 | −1.9 | −1.0 |
| Norton Antivirus | 31 | 71.0 | −4.8 | −2.0 | −2.0 |
| Slack | 24 | 74.1 | −3.5 | 0.1 | 0.3 |
| Google Docs | 109 | 75.4 | −4.8 | −1.8 | −0.8 |
| Mean Diff (Sample) | −3.6 | −1.5 | −0.9 | ||
| Mean Diff (All 100 cases) | −3.7 | −1.6 | −1.5 |
Table 2: Mean differences between observed SUS means and three estimates of SUS from concurrently collected UX-Lite means (LiteDiff = SUS − UMUX-Lite; EaseIntDiff = SUS − EaseInt100; EaseRegDiff = SUS − EaseReg100).
The mean differences and 95% confidence intervals for actual minus estimated SUS results from these 100 studies were
- UX-Lite: −3.7 (95% confidence interval from −4.3 to −3.1)
- EaseInt100: −1.6 (95% confidence interval from −2.2 to −1.1)
- EaseReg100: −1.5 (95% confidence interval from −2.0 to −1.0)
Similar to the pattern in the first dataset, we see the approaches that use only the Ease item performed better at predicting the SUS (EaseInt100 and EaseReg100 differed by −1.6 and −1.5 respectively) than the approach using the UX-Lite (combination of the Ease and Usefulness items), which differed from the SUS mean by −3.7 points.
Estimation for interpolation and regression with the Ease item had similar accuracy. Both were significantly more accurate than estimates made using the entire UX-Lite (no overlap in confidence intervals). The Ease-based confidence intervals do not include 0, but the endpoints indicate that differences larger than, respectively, −2.2 and −2.0 are implausible.
In practice, differences this small are not likely to represent a perceptible difference in perceived usability. For example, Figure 1 shows the Sauro-Lewis curved grading scale for the SUS (one of the publicly available tools commonly used to interpret SUS means). The narrowest score ranges in the figure are 1.4 (for C+ and B−). This means that the smallest difference that can cross more than one boundary between partial grade levels is 2.9, making this a reasonable lower estimate for a difference that might be perceptible in practice.
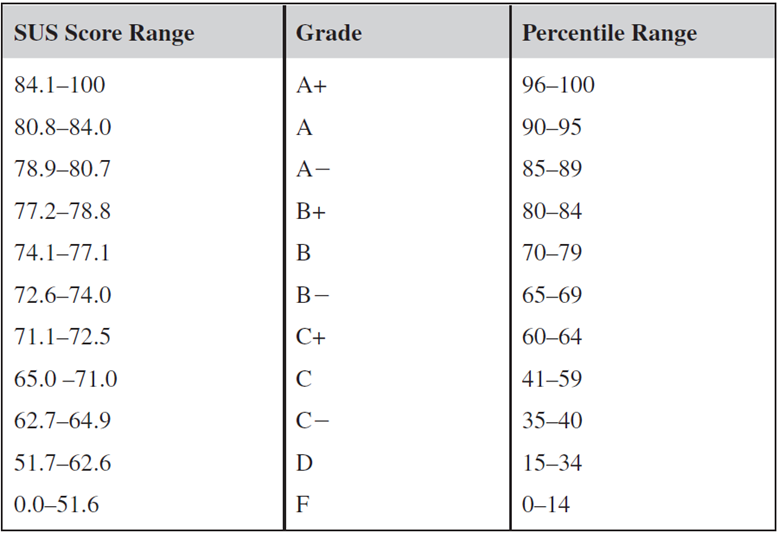
Figure 1: Sauro-Lewis curved grading scale for the SUS.
As a check on the stability of the regression equation developed in 2018, we computed the regression for estimating SUS from Ease with these 100 cases. The resulting equation was SUS = −8.78 + 20.467(Ease), which is not markedly different from the 2018 equation, SUS = −2.279 + 19.2(Ease)—about a 6-point difference in the y-intercept and about a 1.3-point difference in the slope. Figure 2 illustrates the similarity in prediction of these 100 cases using the original 2018 regression equation, interpolation, and the 2021 regression equation.
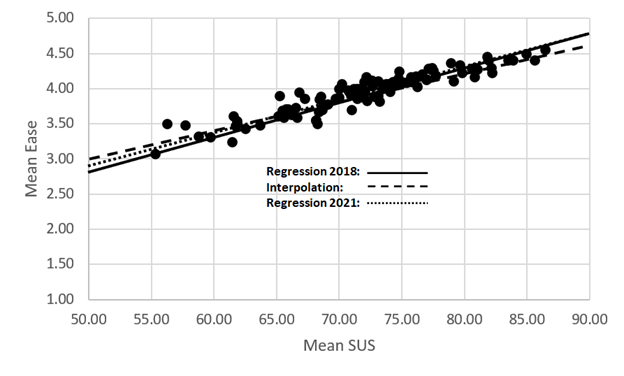
Table 3 shows the values of R2, a measure of regression accuracy, for six estimation methods, the three from Figure 2 and three other approaches (UX-Lite, the original 2018 regression equation using the original 2018 data set, and the 2021 regression equation using the original 2018 data set).
| Method | R2 |
|---|---|
| UX-Lite | 50% |
| Interpolation | 77% |
| 2018 Regression Equation on 2018 Data | 90% |
| 2018 Regression Equation on 2021 Data | 82% |
| 2021 Regression Equation on 2018 Data | 87% |
| 2021 Regression Equation on 2021 Data | 87% |
Table 3: R2 values for various estimates of SUS from UX-Lite data.
These R2 values show that variation in the values of UX-Lite accounted for about half of the variation in SUS. That is very good from a modeling perspective, but it is much less than the variance accounted for with the Ease-based metrics.
The R2 for the 2021 regression applied to the 2021 data set was 87%. However, R2 will always be inflated (overfitted) when assessing the quality of a model with the data used to generate the regression equation. An overfitted model may not work as well with independent sets of data.
For another example, R2 for the 2018 regression was 90% when it was derived from the 2018 data set. When we applied it to the 2021 data, R2 was 87%, a reduction of 3% (and, coincidentally, roughly equal to R2 obtained when using the 2021 regression equation to predict with the 2021 data set).
Notably, 87% is only a bit higher than R2 for the original 2018 regression equation applied to the 2021 data set (82%), which itself is only a bit higher than estimating with interpolation (77%).
These results support the use of either the 2018 regression (EaseReg100) or Ease interpolation (EaseInt100) to estimate SUS, with the 2018 regression metric having a slight (but not statistically significant) advantage. Also, the quality of the 2021 regression model is encouraging, but unless we find a much better regression equation, we plan to continue using the 2018 regression in our practice for consistency with our previous research.
Key Takeaways and Discussion
Although the historical approach to estimating SUS from UMUX-derived metrics has been to compare UMUX-Lite with SUS, these new analyses demonstrate that estimation may be more accurate when you use just the Ease item—a finding that is both pragmatic and better grounded in usability theory.
We explored two ways to use Ease to estimate SUS: regression and interpolation. Both methods generated SUS scores to within 2% accuracy (< 2 points on a 100-point scale). For our data, regression was a bit more accurate as reflected in the mean difference and R2. In the larger dataset, the regression equation systematically overestimated SUS scores by about 1.5 points (a slight positive bias). We’ll continue to examine additional data to determine whether an updated regression equation (or a simple one-point adjustment) ends up being more accurate in the long run.
It’s important to keep in mind, however, that this outcome is based primarily on 100 studies conducted at MeasuringU in which we added the UX-Lite Usefulness item to our SUS grid, combining those ratings with the SUS Ease item to compute the UX-Lite. Correspondence with the SUS might be as good or better with UX-Lite scores for data collected in different research contexts. We advise researchers who have been collecting both measures to examine their data to see whether their estimates of SUS would be better, the same, or worse with our new Ease-based methods. (And let us know, either through our Contact Us form or by publishing your findings.)