 The System Usability Scale (SUS) has been around for decades and is used by hundreds of organizations globally.
The 10-item SUS questionnaire is a measure of a user’s perception of the usability of a “system,” which can be anything from software, hardware, websites, apps, or voice interfaces.
The items are:
- I think that I would like to use this system frequently.
- I found the system unnecessarily complex.
- I thought the system was easy to use.
- I think that I would need the support of a technical person to be able to use this system.
- I found the various functions in this system were well integrated.
- I thought there was too much inconsistency in this system.
- I would imagine that most people would learn to use this system very quickly.
- I found the system very cumbersome/awkward to use.
- I felt very confident using the system.
- I needed to learn a lot of things before I could get going with this system.
Why 10 items?
The SUS was built by John Brooke using an approach inspired by what’s come to be known as Classical Test Theory in psychometrics. He started with 50 items that he thought would address the construct of what people think of when they think of the ease of use of systems.
The final set of 10 were the ones that best differentiated between a software application that was known to be easy and one that was difficult. The original study used a relatively small sample size (n = 20) and reliability figures weren’t reported. Later research with more data has shown these final 10 items correlate with each other (some very highly, r > .7), with the total SUS score (all r > .62), and have high internal consistency reliability (Cronbach Alpha > .85).
The items are somewhat redundant (hence the high intercorrelations) but some redundancy is by design. To achieve high reliability in Classical Test Theory, you essentially ask the same question about a single construct in many different ways.
At the time the SUS was put forth, it was believed that these 10 items measured only one construct (perceived use). With only 20 participants, it was difficult to test whether the SUS was unidimensional. With more items, the greater the chance of measuring more than one construct.
About 10 years ago, Jim Lewis and I had enough data collected to test the dimensionality of the SUS using a factor analysis. We originally found two dimensions, which we labeled “usability” and “learnability” based on the items that loaded on each factor. This finding was even replicated by other researchers. However, with more data sets we found that the two dimensions were actually an artifact of the positively worded and negatively worded items [pdf] and not two meaningful dimensions about perceived ease.
In other words, the SUS is after all unidimensional—measuring only the construct of perceived usability. And if it’s measuring only a single construct, do we still need all 10 items?
Too Redundant?
While the SUS is relatively short, are all 10 items necessary? How much is lost by reducing the number of items? How accurate would the SUS be if we used only two items (the bare minimum to assess reliability or load on a factor) or even a single item, which we’ve found sufficient for other simple constructs, including individual SUS items.
To find out, we analyzed SUS scores from 16,010 respondents from 148 products and websites with between 5 and 1,969 responses per product experience—one of the largest sets of SUS scores ever analyzed.
SUS scores for an interface are created by averaging together all the individual scores. Predicting individual scores is more difficult because of the higher variability at the participant level and a topic for a future article. Because our goal is to estimate the SUS score by product, we computed SUS scores for the 148 products, then created average scores for each of the 10 items. We tested all combinations of items to predict the SUS scores.
We found three items to have the highest correlations to the total SUS score: item 2 (r = .96), item 3 (r = .95), and item 8 (r = .95) weren’t statistically different from each other. Each of these items alone can explain at least a whopping 90% of the variation in SUS scores.
The best two-item combination are items 3 and 8 and then items 7 and 8, which together account for 96% of the variability in SUS scores by product. It’s interesting that item 8 is one of the best predictors because this is also the item that’s caused some trouble for respondents—cumbersome is usually changed to awkward because some participants have trouble understanding what cumbersome means. We suspect this item best predicts SUS because it’s related to the negatively worded tone of half the items in the SUS score. It could also be that these negative items add error to the measurement—people respond differently to negative items rather than the experience—and is a good topic for our future research.
Interestingly, there is a significant diminishing return after adding two more items to predict SUS scores. The best combination of three items only adds 1.8% more explanatory power than two items. And adding four items only adds 0.8% more explanatory power. Table 1 shows how much explanatory power each best combination of variables adds to predicting the overall SUS score compared to one fewer item.
| # of Items | R-Sq(adj) | Improved Prediction |
|---|---|---|
| 1 | 91.7 | |
| 2 | 96.1 | 4.4 |
| 3 | 97.9 | 1.8 |
| 4 | 98.7 | 0.8 |
| 5 | 99.2 | 0.5 |
| 6 | 99.4 | 0.2 |
| 7 | 99.6 | 0.2 |
| 8 | 99.8 | 0.2 |
| 9 | 99.9 | 0.1 |
| 10 | 100 | 0.1 |
Table 1: Improved prediction in going from 1 to 2, 3… 10 items.
Using Item 3: Easy To Use
With the similar high correlations between the best single item, we selected item 3 (I thought the system was easy to use), which we felt has the best content validity and is used in other questionnaires (SUPR-Q, UMUX Lite). You can see the relationship between the mean of item 3 and the total SUS score in the plot in Figure 1.
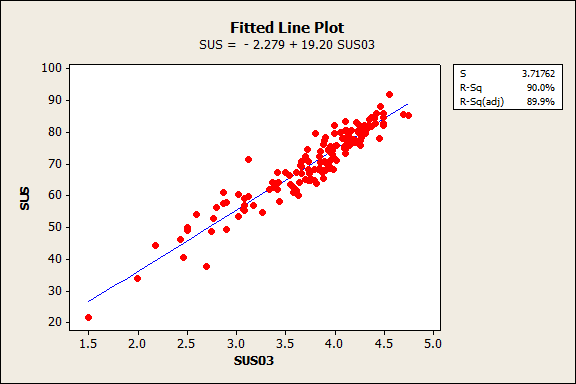
Figure 1: Item 3 (“I thought the system was easy to use”) accounts for 90% of the variation in total SUS scores at the product level.
To predict the SUS score from item 3, we simply use the regression equation:
SUS (estimated) = -2.279 + 19.2048 (Mean of Item 3)
The following calculator will do the math for you. Enter the mean of Item 3 to get a predicted SUS score.
To predict a SUS score using items 3 and 8, use the regression equation:
SUS (estimated) = -6.33 + 9.85 (SUS03) + 10.2(reverse coded item SUS08*)
*Note: The negatively worded items have been reverse-coded in our regression equation and scaled from 1 to 5 so higher values all indicate better scores.
For example, if a product receives a mean score of 3.43 on item 3, it has a predicted SUS score of about 64:
SUS (estimated) = -2.279 + 19.2048 (3.43)
SUS (estimated) = 63.59
If a product receives a mean score of 3.81 on item 3, and 3.48 on item 8,* then the predicted SUS score is about 67:
SUS (estimated) = -6.33 + 9.85 (3.81) + 10.2(3.48)
SUS (estimated) = 66.68
How much is lost?
By reducing the number of items, we, of course, lose information. We introduce errors: the fewer the items, the less accurate the prediction of the 10-item SUS score. Some estimates will overestimate the actual SUS while others will underestimate it. We can assess how much is lost when using fewer items by using the regression equations, generating a predicted SUS score, and then comparing the predicted scores to the actual scores from this data set.
For example, one of the products in the dataset had a SUS score of 76.8. (See Table 2.) Using the mean from item 3 (4.20), the predicted SUS score is 78.4 (from the regression equation). This represents an error of 1.6 points or about 2%. Using the means from items 3 and 8 in the regression equation, the predicted SUS score is 77, an error of only 0.3%.
| Item | Mean |
|---|---|
| 1 | 4.03 |
| 2 | 4.07 |
| 3 | 4.20 |
| 4 | 4.03 |
| 5 | 4.03 |
| 6 | 4.10 |
| 7 | 3.98 |
| 8 | 4.12 |
| 9 | 4.23 |
| 10 | 3.93 |
| Actual SUS Score | 76.8 |
| Item 3 Predicted SUS | 78.4 |
| Error(%) | 1.6(2%) |
| Items 3&8 Predicted SUS | 77.0 |
| Raw Error | 0.3(0.3%) |
Table 2: Means for each of the 10 SUS items for a software product in the database.
Across all 148 products, the median absolute error is 3.5% when using item 3 alone and 2.1% when using both items 3 and 8. However, in some cases, the score for item 3 was off the mark (predictions are rarely perfect). Eight products had a predicted value that deviated by at least 6 points (the highest deviation was 13.8 points). It’s unclear whether some of these deviations can be explained by improper coding of the SUS or other scoring aberrations that may be examined in future research.
Figure 2 shows the predicted SUS score from using just item 3. For example, if the mean score is 4 on item 3 from a group of participants, the estimated SUS score is 75. Anything below 3 isn’t good (below a predicted SUS score of 55) and anything above 4.5 is very good (above a predicted SUS of 84).
 Figure 2: Predicted SUS score from the mean of item 3.
Grade Change
SUS scores can be interpreted by associating letter grades based on their percentile rank. The best performing products above the 90th percentile get an A (raw scores of 80.8), average products around the 50th percentile get a C (raw SUS scores around 68), and anything below the 14th percentile gets a failing grade of F (raw scores of 52).
Another way to interpret the accuracy of the prediction is to see how well the predicted SUS scores predict the associated SUS grades. A bit more than half (57%) product grades (84) differed between the predicted and actual SUS score. While this seems like a lot of deviation, of these 84, 57 (68%) only changed by half a letter grade. Figure 3 shows the differences between predicted grades and actual grades from the full 10 items.
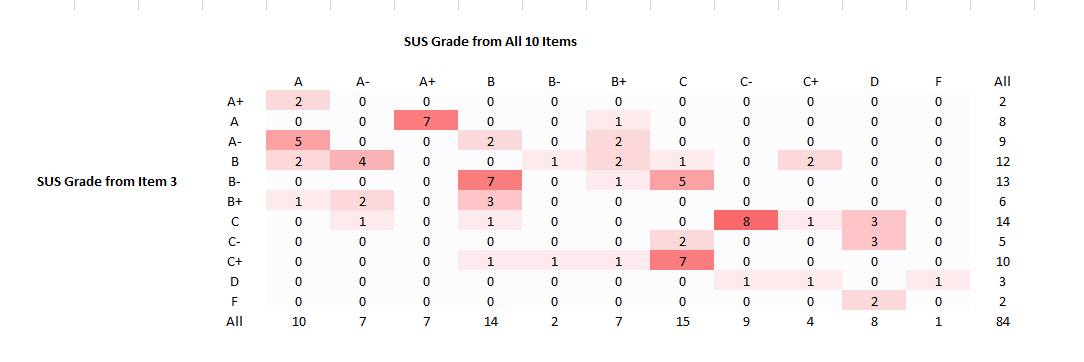
Figure 3: Grade differences between item 3 only and the full 10 items.
For example, 7 products were predicted to be a B- using only item 3 but ended up being Bs for the full 10 items. Or put another way, 82% of all grades stayed the same or differed by half a letter grade (121 out of the 148 products). An example of predicted scores that changed more than half a letter grade were 6 products predicted to be a B, but ended up being an A- or A using the full 10 items (see Figure 3 row that starts with “B”).
We can continue with the grading metaphor by assigning letter grades numbers, as is done to compute a Grade Point Average or GPA (having high school flashbacks now?). The College Board method assigns numbers to grades (A = 4, B = 3, C = 2, D = 1, F=0, and the “+” and “-” get a 0.3 adjustment from the base letter value in the indicated direction.
| Letter Grade | 4.0 Scale |
|---|---|
| A+ | 4.0 |
| A | 4.0 |
| A- | 3.7 |
| B+ | 3.3 |
| B | 3.0 |
| B- | 2.7 |
| C+ | 2.3 |
| C | 2.0 |
| C- | 1.7 |
| D+ | 1.3 |
| D | 1.0 |
| F | 0.0 |
Table 3: Number assigned to letters using the College Board designations.
The average GPA of the 148 products is 2.46 (about a C+) and the average GPA using the predicted grade is also 2.46! In fact, the difference is only 0.0014 points (not statistically different; p = .97). This is in large part because a lot of the half grade differences washed out and 7 products had predicted A scores but were actually A+ (both A and A+ have the same GPA number of 4).
Summary and Conclusions
An analysis of over 16,000 individual SUS responses across 148 products found that you can use a single item to predict a SUS score with high accuracy. Doing this has a cost though, as some information is lost (as is the case with most predictions).
Item 3 predicts SUS scores with 90% accuracy. If researchers ask only the single “easy to use” item 3, they can still predict SUS scores with 90% accuracy and expect the full SUS score to differ on average by 3.5% from the prediction.
Two items predict with 96% accuracy. Using only two items (item 3 and 8) can predict the SUS with 96% accuracy and expect the full SUS score to differ on average by 2.1% from the prediction. Future research will examine whether there are better ways to predict the SUS using different items (e.g. the UMUX-Lite).
After Three items Not Much Is Gained: There is a major diminishing return in adding additional items to improve the SUS score prediction. After three items, each additional item adds less than 1% to the accuracy of the SUS score.
Grades differ only slightly. By using only a single item to generate a grade, 82% of all grades were the same or differed by less than half a grade (e.g. predicted A-, actual B+) compared to the full 10-item grades. Using the GPA method, the average GPA was essentially identical, suggesting differences are minor.
Thanks to Jim Lewis and Lawton Pybus for contributing to this analysis.