 How do we know what a good measure is?
We have written extensively about the benefits of using standardized measures such as questionnaires to measure the user experience. We have also written about the processes and methods used to build a standardized questionnaire. But where do these methods come from? Are they the best ones? Do they need updating?
In most cases, the process for developing a standardized questionnaire is based on a methodology (and theoretical foundation) known as classical test theory, which evolved in the early 20th century. But has anything changed in the last hundred years? A major development is a set of complementary methods called Rasch analysis and item response theory, which provide additional techniques for developing measures that can be applied to UX research.
Rasch analysis is an analytical method created by Georg Rasch for developing tests of abilities based on responses to questions that have right and wrong answers. The basic idea is that you want to include items that vary sufficiently in difficulty so that the test score (based on the number of correct items) will be a sensitive measure of a wide range of individual abilities.
Since the introduction of Rasch analysis in 1960, researchers have extended the modeling of right/wrong dichotomous items to other dichotomous metrics, such as yes/no answers to a series of items that vary in how likely people are to agree with them. Rasch analysis has also been extended to the modeling of items with multiple response options that have ordinal relationships (e.g., 1: Strongly Disagree, 2: Disagree, 3: Neither Agree nor Disagree, 4: Agree, 5: Strongly Agree).
In this article, we contrast Rasch analysis with other approaches to measuring human sensations and attitudes, describe how Rasch analysis was used to create the mobile version of the Standardized User Experience Percentile Rank Questionnaire (SUPR-Qm®), and provide guidance on when to use Rasch analysis to develop standardized UX questionnaires.
Psychometrics and Psychophysics: A Brief History
The two major branches of scientific efforts to quantify human feelings are psychophysics and psychometrics. Psychometrics is in turn divided into classical test theory (CTT) and item response theory (IRT).
Psychophysics
Psychophysics had its start in the early- to mid-19th century with the work of Ernst Weber (on just noticeable differences) and Gustav Fechner (on sensory thresholds). Their efforts culminated in Fechner’s Law: S = k(log10I)—suggesting that there is a logarithmic relationship between the intensity of a physical stimulus (I) and its perceived sensation (S). About a hundred years later, Fechner’s Law was replaced in most psychophysics work by Stevens’ Power Law: S = kIn, which provided a better fit for most relationships. In his work, Fechner developed a variety of experimental methods, one of which was magnitude estimation. In magnitude estimation, participants judge the intensity of a stimulus against a baseline stimulus (e.g., how bright a stimulus light is as a ratio of the perceived brightness of a reference light—five times as bright, half as bright, etc.).
There have been some attempts to apply magnitude estimation to the perception of usability, with mixed success. Cordes (1984) and McGee (2003) reported successful use of usability magnitude estimation (UME), but Tedesco and Tullis (2006) and Sauro and Dumas (2009) found participants struggled with making the necessary ratio judgments. In traditional usability testing, this means moderators would need additional interaction with participants to get UME metrics, and the method doesn’t appear to be at all suitable for unmoderated usability tests, limiting its usefulness to UX researchers.
Psychometrics
Unlike psychophysics, which focuses on modeling the relationship between intensity and perception of a stimulus with log or power formulas, psychometrics develops sets of items that, when scored, produce measurements that are reliable (repeatable) and valid (measure what they intend to measure). The two major approaches to this are CTT and IRT (Cappelleri et al., 2014).
Classical Test Theory (CTT)
CTT refers to a collection of methods for the development and evaluation of standardized tests and questionnaires, with analytical roots in the first decade of the 20th century (the quantitative methods of Karl Pearson and Charles Spearman) and codified in Harold Gulliksen’s 1950 book, Theory of Mental Tests. A basic principle of CTT is that every measurement has two components—true score (T: the true value) and error (E: random effects). From this basic principle, formulas can be developed or adapted for the assessment of scale reliability, validity, factor analysis (exploratory or confirmatory), and item analysis.
A commonly used process for the development of standardized tests with CTT, described by Lewis (2016 [PDF]), is as follows:
- Hypothesize construct. Establish the domain of interest and review the literature.
- Develop initial set of items. Use the prior literature and brainstorm with colleagues to establish content validity.
- Test initial item set. Collect data, conduct exploratory factor analysis, estimate reliability and validity, analyze items to identify candidates for removal.
- Test revised item set. Collect new data, conduct confirmatory factor analysis, confirm reliability, validity, and appropriateness of items. Iterate as needed.
- Develop norms. Use the final questionnaire across a wide variety of measurement contexts to establish a normative database for conversion of raw scores to percentiles.
This process was used to develop the SUPR-Q®, a standardized questionnaire for UX assessment of websites (Sauro, 2015). From 33 items in its initial set, the final version of the SUPR-Q measures four constructs (Usability, Credibility, Appearance, and Loyalty) with only two items each.
Item Response Theory (IRT) and Rasch Analysis
IRT is a collection of measurement models of the relationships between item responses on a scale with an underlying construct (e.g., latent trait). Historically, these methods have two points of origin. In the U.S., Frederick Lord (1953 [PDF]) published “The Relation of Test Score to the Trait Underlying the Test,” the first paper to describe an IRT-like latent trait model. Independently, the Danish statistician Georg Rasch (1960) developed a similar approach to test development. Rasch met Benjamin Wright on a trip to the U.S., and subsequently, Wright and his students spent decades extending the capabilities of Rasch models and developing influential analytical software for Rasch analysis (WinSteps).
At a high level, the process for standardized test development using Rasch analysis is similar to the CTT process. Start by hypothesizing the construct of interest, develop the initial set of items, collect data to analyze the initial item set, and adjust based on the results (discard poor items and add new ones if necessary). Test the revised item set and iterate as needed until you have an acceptable set of items.
At a low level, the analytical tools for Rasch analysis are very different from those used in CTT, reflecting fundamental differences in their theoretical bases. Rather than using factor analysis to guide item retention decisions, a critical visualization in Rasch analysis is the Wright map, which puts item difficulty and person scores computed from a set of data on a common logit (log odds) scale. Item retention/exclusion decisions are made based on the extent to which items cover a good range of difficulty without overlap or large gaps as represented on the Wright map. Poor items can also be identified by examination of infit and outfit statistics.
Case Study: The SUPR-Qm
Despite having been used for several decades in the creation of questionnaires and achievement tests, it’s unlikely that most UX practitioners are familiar with IRT and Rasch modeling. Almost all standardized UX questionnaires in current use were developed using or inspired by CTT. The SUPR-Qm (Sauro, 2017), in contrast, was developed using Rasch methods to get a unidimensional measure of the hypothesized construct of user experience with mobile apps.
Initial Item Identification
There were 23 items in the initial set, covering the utility, usability, intended usage, and reasons for deleting apps, plus four free-response questions. Ratings of those items from a sample of 104 Amazon Mechanical Turk participants indicated that two were not sufficiently applicable. Analysis of responses to the free-form questions informed the generation of additional items.
Item Refinement and Assessment in Three Contexts
The second study evaluated the properties of 34 items using data from 341 Mechanical Turk respondents. Respondents were assigned to one of three groups: (1) was presented with a list of 15 popular apps and selected the one they used the most; (2) selected an app from the list that they didn’t use much but was still on their phone, and (3) rated the app they had used most recently.
Principal component analysis of the items indicated multidimensionality rather than the unidimensionality required for a Rasch scale. We removed seven items for having excessively high infit or outfit values. A similar analysis was used to remove ten respondents from the sample (high infit or outfit due to unusual response patterns).
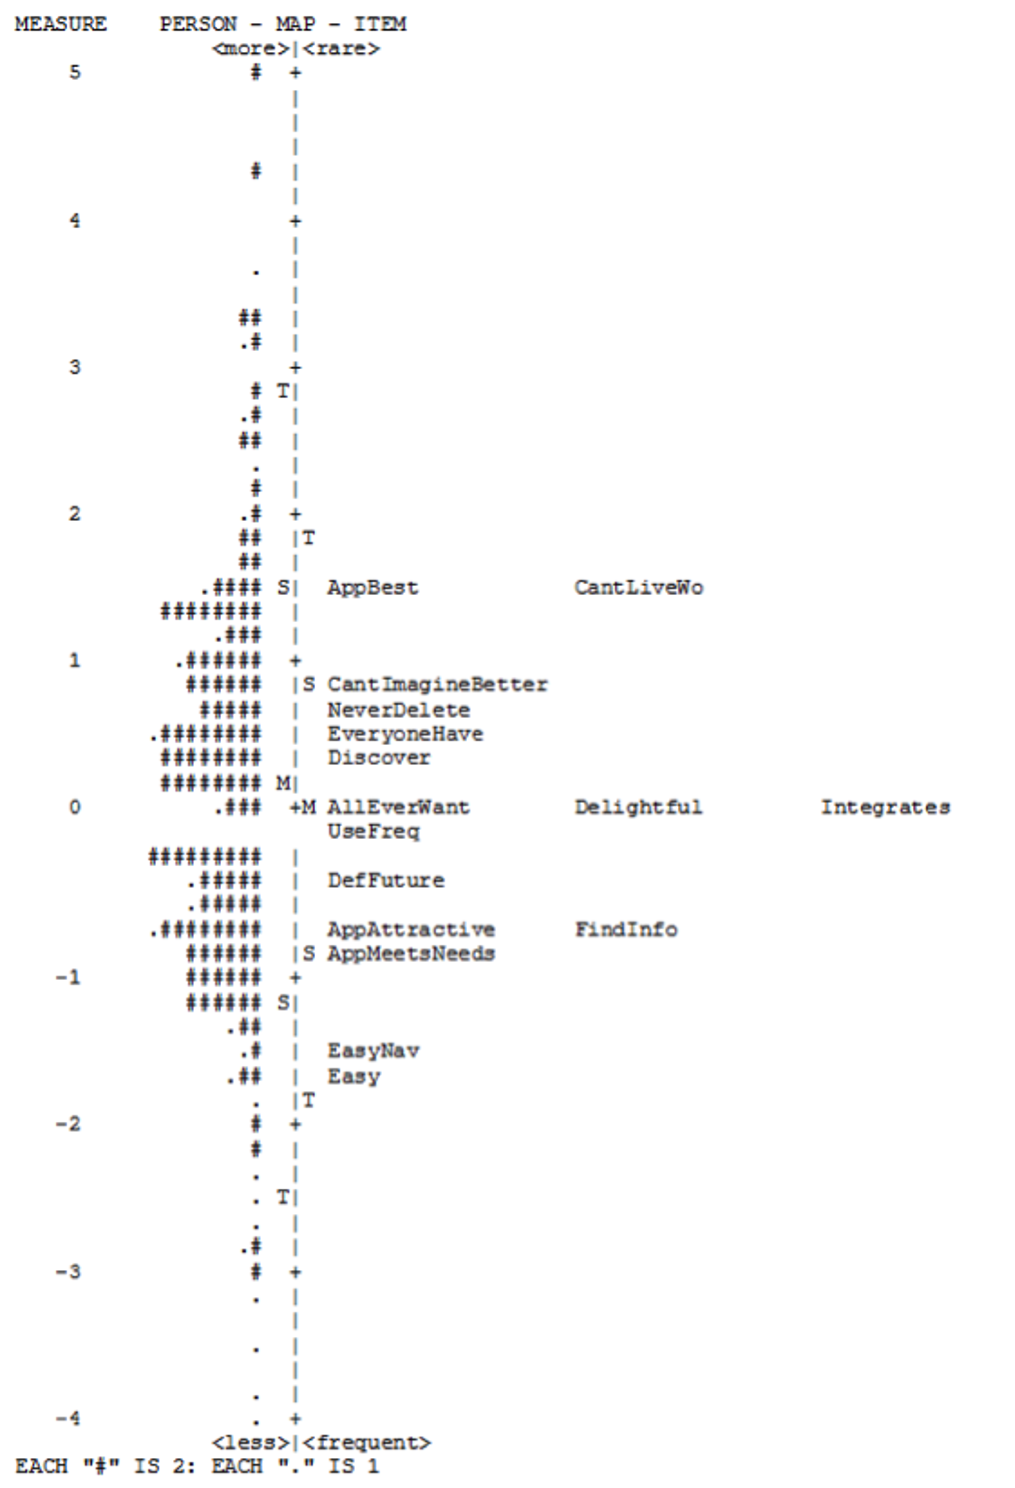
Figure 1 shows the Wright map for the remaining items, organized as two vertical histograms with the items and respondents (persons) arranged from easiest on the bottom to most difficult on the top. For example, most participants agreed or strongly agreed (4s and 5s) to the items “Easy” (the app is easy to use) and “Clean” (the app has a clean and simple presentation). In contrast, fewer participants rated apps as “AppBest” (best app they’ve ever used) or “CantLivewo” (can’t live without the app), so they appear the highest among the items on the map (hardest to agree with).

One indicator of a good measure is to have the mean of the items and the mean of the persons opposite each other on the map. The sample of respondents showed an above-average score of .77 compared to the average item score of 0 logits (indicated with “M” on each side of the logit scale). The items did a good job of covering the middle and lower-scoring persons, but coverage was poor for higher-scoring persons. This suggests a need to develop and add some more-difficult items (harder to agree with) to differentiate these higher levels.
There was redundancy in the middle levels of agreement, with several items (e.g., Fun, Happy, Integrates) having similar logit positions. In Rasch scaling, items that discriminate at a similar level are good candidates for removal.
Final Item Set
Additional studies attempted to develop items that would be harder for respondents to agree with (not successful) and removed excessively redundant items (successful). Our evaluation of the remaining 16 items (from 284 Mechanical Turk respondents divided into the same groups as in the second study) produced the Wright map in Figure 2.
All the items had acceptable infit and outfit values. The item and person means were almost the same. Respondents readily endorsed the ease-of-use items (Easy, EasyNav), suggesting that usability is necessary but not sufficient for a good user experience. In contrast, “CantLiveWo” and “AppBest” were the most difficult items to endorse.
CTT versus IRT for UX Research
Whether CTT or IRT (including Rasch analysis) is the better approach for the development of a standardized UX questionnaire depends on the measurement goals.
CTT tends to generate a set of items that are optimized around the average level of a construct. IRT, by contrast, optimizes around a questionnaire that reliably measures a fuller range of the construct, from low to high, not just around the average.
Regarding levels of measurement, IRT methods produce scales that have an interval level of measurement. CTT scales are theoretically ordinal, but in practice, they can be treated as interval for the purpose of statistical analysis as long as researchers avoid making interval claims about the results.
CTT can be used to develop unidimensional measures, but it is easily and frequently extended to multidimensional questionnaires. IRT focuses on the development of unidimensional measures.
In some cases, especially in industrial research, application of CTT methodology results in very efficient questionnaires. For example, the SUPR-Q (Sauro, 2015), with only eight items, reliably measures four constructs that can be combined into an overall score. Two items per construct are not enough to get a maximally sensitive measure of each construct, but all together, the four constructs are very useful for characterizing the UX quality of a website. This is especially true when using SUPR-Q’s normative database, which enables transforming raw scores to percentiles. Thus, a single SUPR-Q score does not provide much information about the individual who made the ratings, but by merging many scores, the profile for a website becomes meaningful.
Jabrayilov, Emons, and Sijtsma (2016) conducted research to compare CTT and IRT in the context of individual change assessment in clinical psychology. They found that IRT could be superior to CTT in individual change assessment, but only when the IRT version had at least twenty items. However, when it’s important to obtain meaningful measurements of individuals (e.g., clinical psychology, college placement exams, other individual differences), IRT has a clear advantage over CTT through the discriminative power of IRT item sets.
As we at MeasuringU continue to develop standardized UX metrics, we plan to keep both CTT and IRT in our toolboxes. Table 1 summarizes our current thinking on when to use CTT or IRT in scale development.
| Measurement Goal | Classical Test Theory (CTT) | Item Response Theory (IRT) |
|---|---|---|
| Unidimensional | ||
| Multidimensional | ||
| Must have small number of items | ||
| Can have large number of items | ||
| Measure items and people on same scale | ||
| Item analysis with factor analysis/loadings | ||
| Item analysis with Wright map/infit/outfit | ||
| Focus on product measurement | ||
| Focus on individual differences |
Table 1: Summary of considerations for CTT versus IRT in UX scale development.
In most cases, CTT is appropriate for developing standardized UX questionnaires. But when the measurement goal is a unidimensional measure, which can have a large number of items focusing on the measurement of individual differences, the more appropriate method is IRT (including Rasch analysis).