 You can make graphs in 3D. They change up often banal-looking flat graphs. But is it more than just an aesthetic decision? Does adding a third dimension to bar graphs make it easier or harder for people to interpret?
In an earlier article, we reviewed the literature on the use of 3D graphs. There are numerous ways to assess graph effectiveness (e.g., accuracy of estimating values, accuracy of making comparisons, time to make decisions). While Tufte (1983) has strong opinions against the use of 3D graphs, the findings reported in the literature are a bit more nuanced. In most cases, 2D graphs appear to be at least as good as or slightly better than 3D graphs, but in rare cases, 3D graphs may have a slight advantage.
The results of UX research, especially from surveys and unmoderated studies, are often shown using tables and graphs. In this article, we describe an experiment we conducted using the click testing feature of our MUIQ® platform to investigate how quickly and accurately people could compare two graphed values presented in 2D and 3D bar formats and which they preferred.
3D vs. 2D Bar Graph Study Details
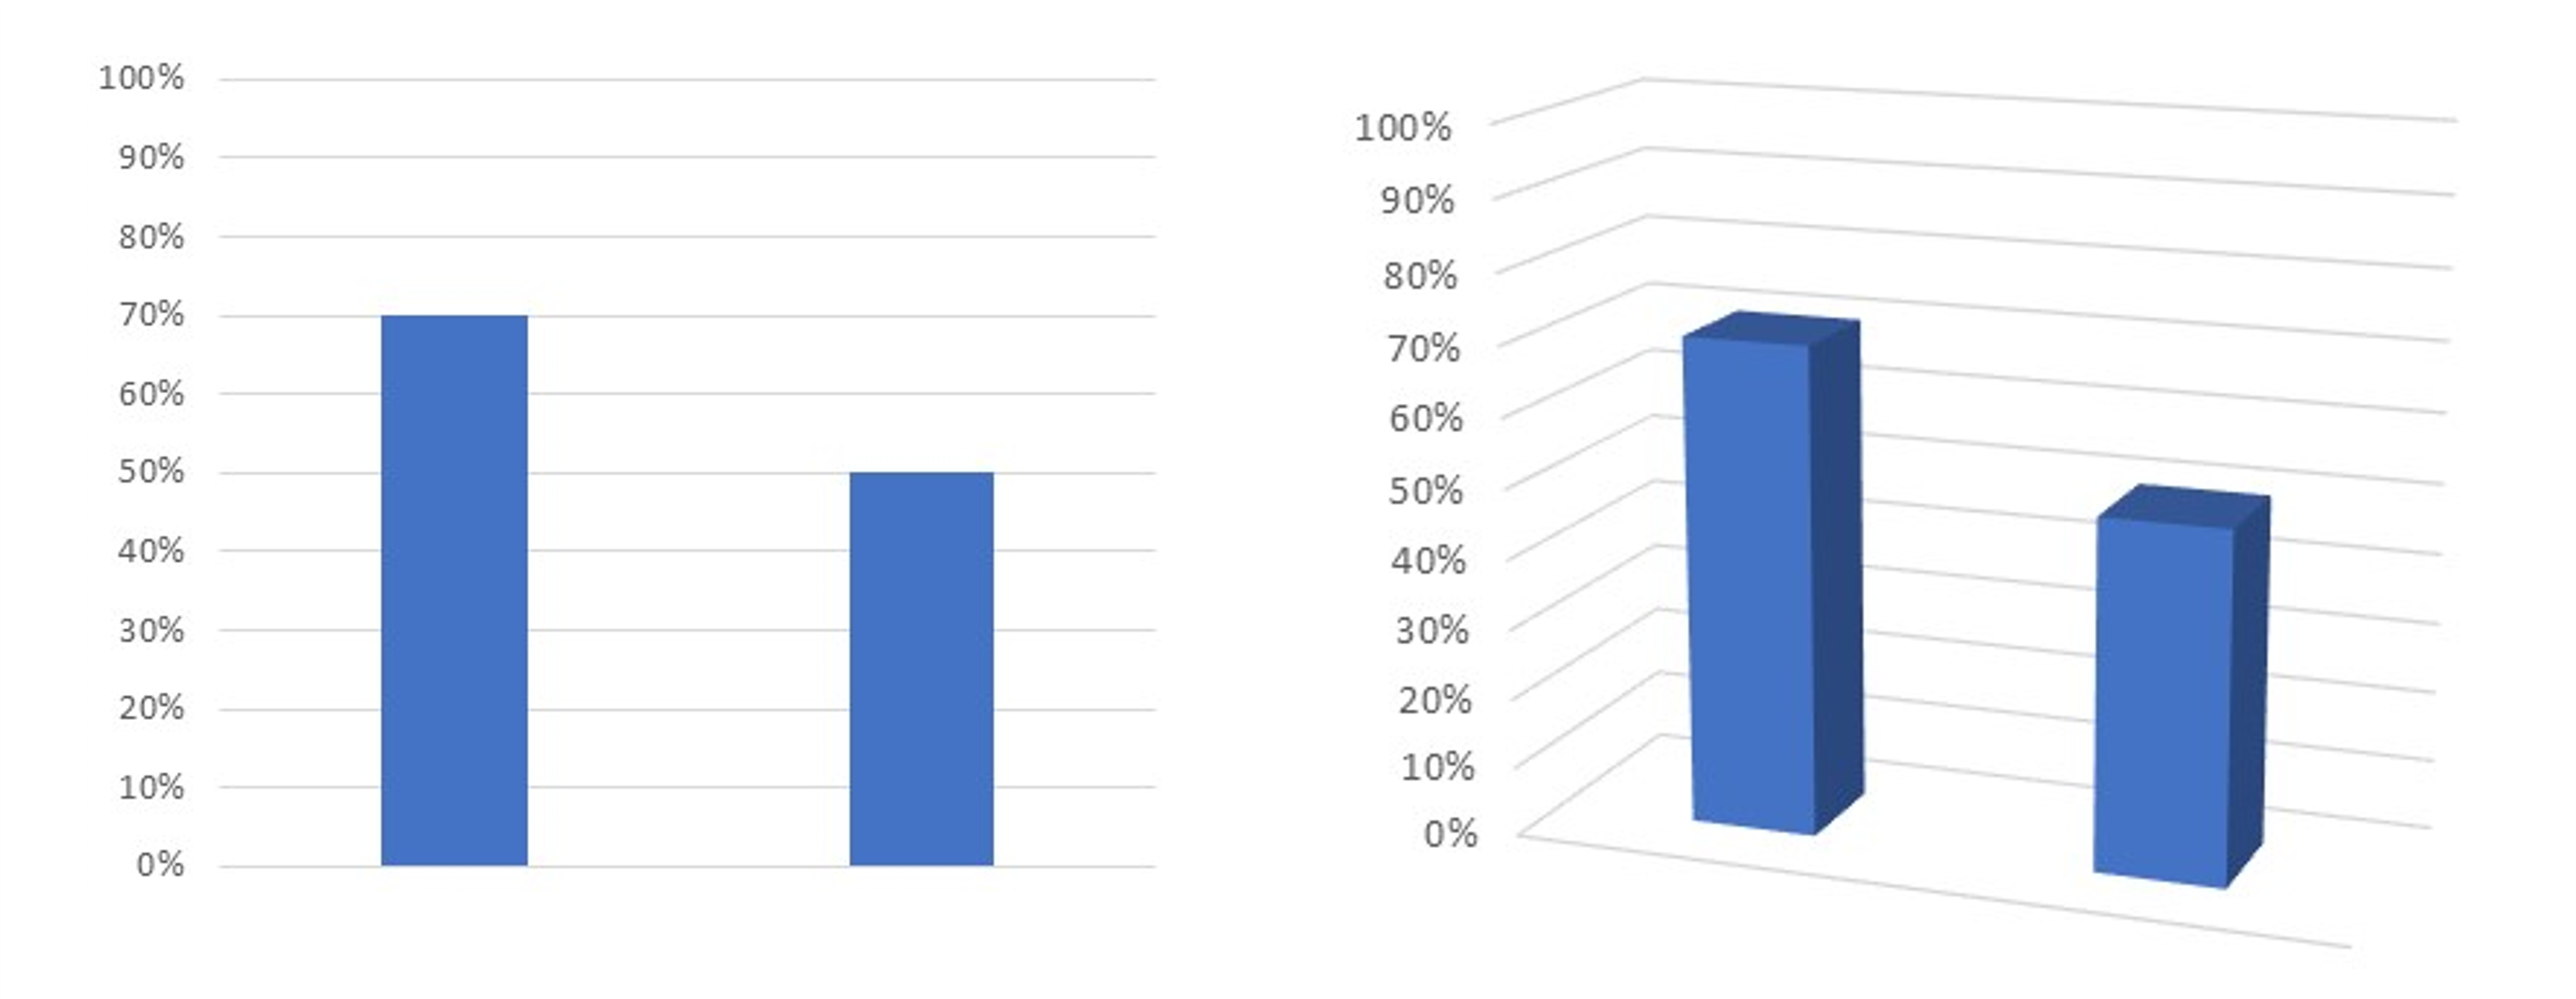
In February 2023, we recruited participants from a U.S.-based online panel company. In a fully within-subjects experimental design, participants viewed 30 graphs like the examples shown in Figure 1 in a timed MUiQ click test.
Experimental Design
The 30 graphs showed two data points in which each pair varied in three ways:
- Dimensions: There were an equal number of 2D and 3D depictions (15 2D graphs and 15 3D graphs).
- Size Difference: The lower magnitude in all graphs was set to 50%, and the other magnitude was from 0 to 35 percentage points higher (eight gradations from 50% to 85%; e.g., 50% vs. 50%, 50 vs. 55%, 50% vs. 60%, … 50% vs. 85%).
- Placement: The higher percentage appeared on the left or right side for each combination of dimension and size difference (only once for each dimension when bars were equal).
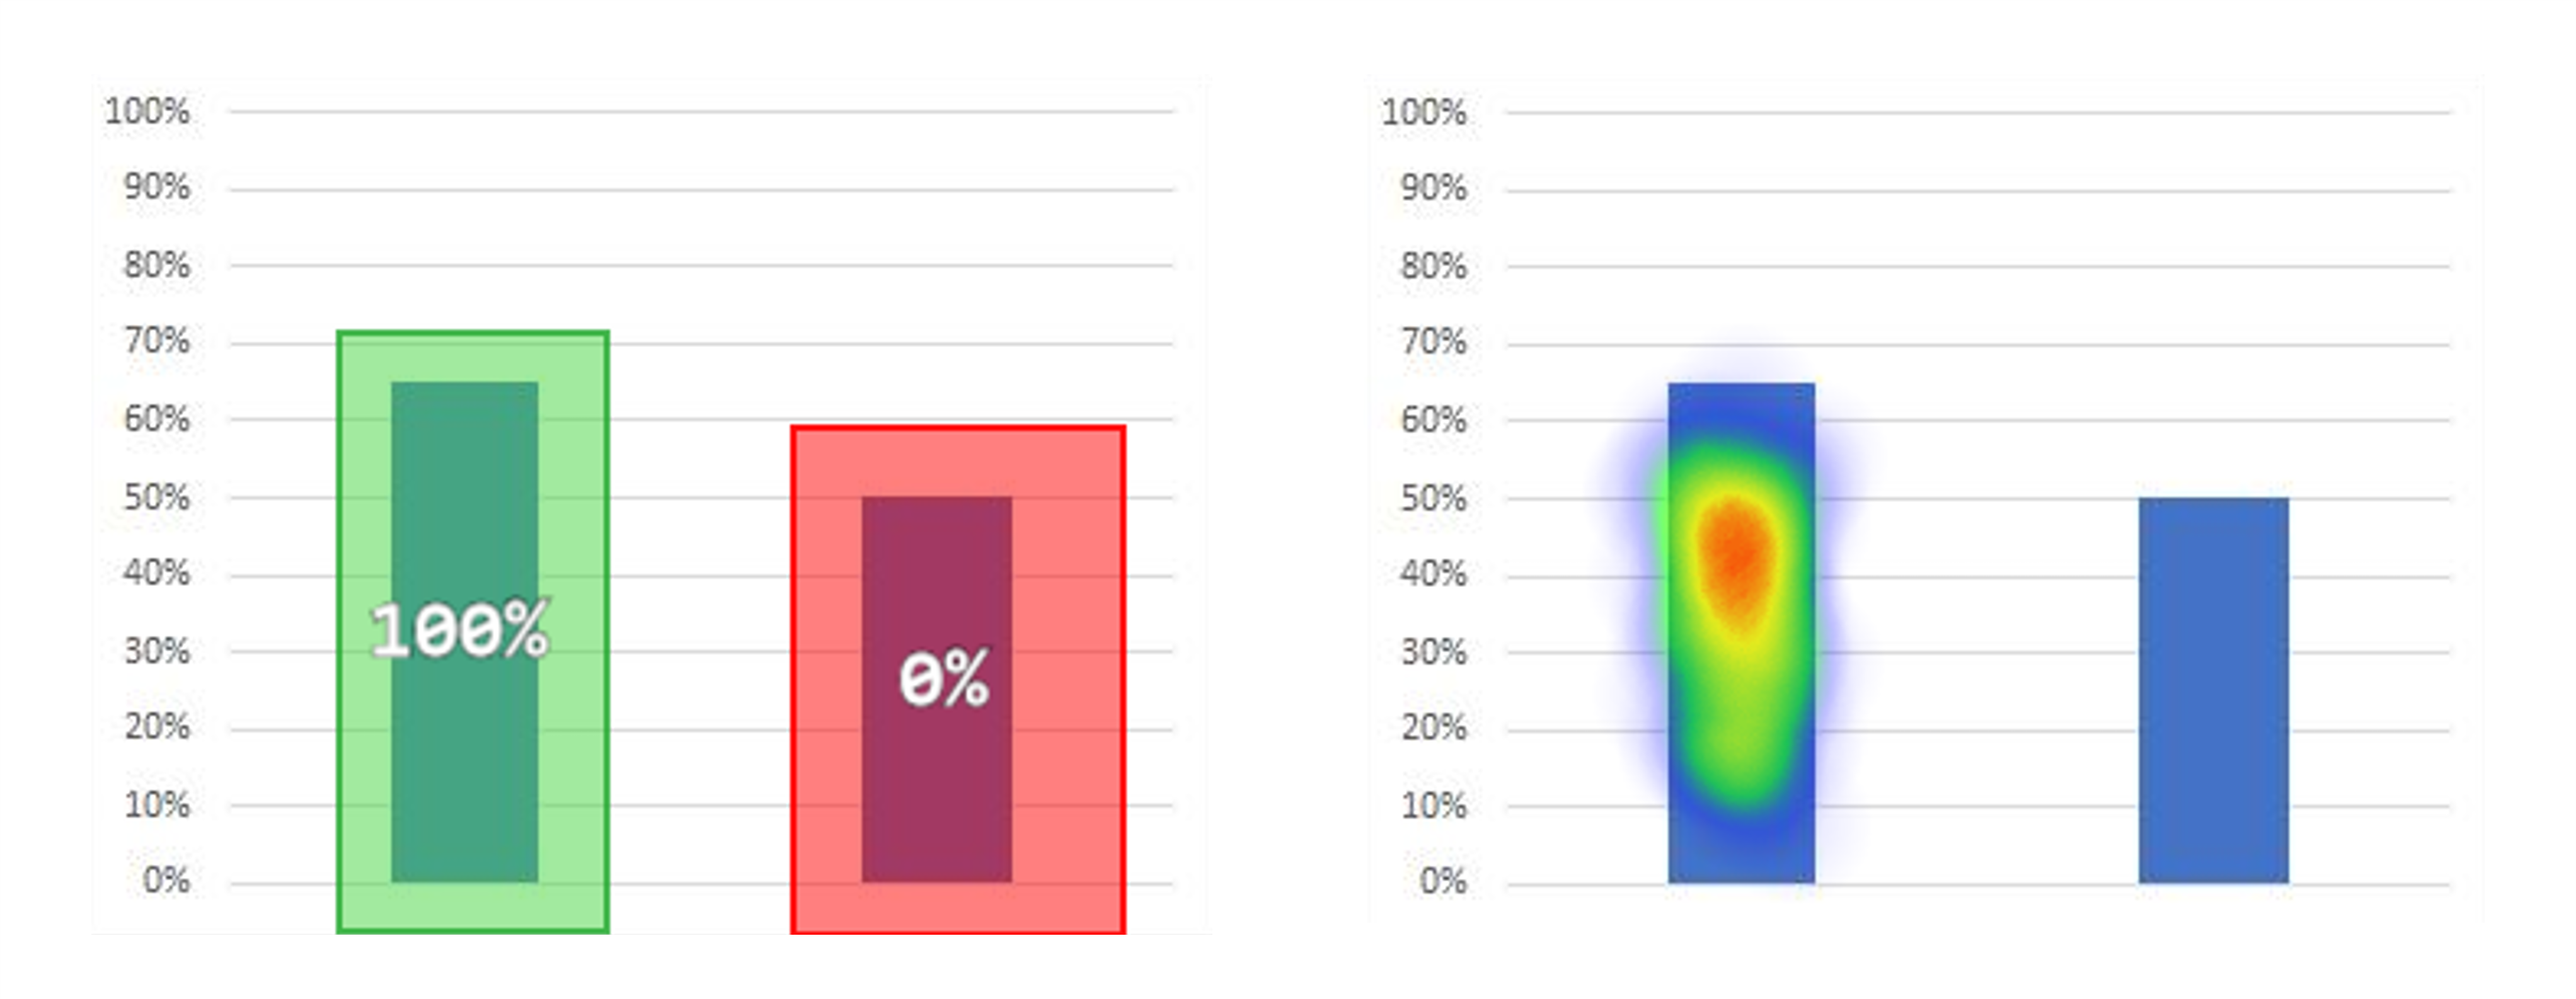
Participants were instructed that they would see 30 images, one at a time, with ten seconds to click on the bar that depicted the larger amount. Images appeared in randomized orders. The study advanced to the next graph when participants clicked on their selection (they couldn’t change their clicks or go back). Participants could pause between each graph and proceed when ready.
Video 1: Example of participant experience taking the survey.
The accuracy of the judgments and the time to select the graph were the primary dependent variables. If participants didn’t make a selection within 10 seconds, the trial was marked as incorrect. Twenty-eight of the thirty graphs shown to participants contained differences, while two had no differences (both bars set to 50% to act as a control). At the end of the study, participants selected their preferred graph type (2D or 3D).
Study Results
We obtained data from 99 participants. The median total study duration was 3 minutes and 18 seconds.
Accuracy
We found no significant differences in selection accuracy between 3D and 2D graphs. Overall, participants were very accurate (Figure 2). Across the 2,772 trials that showed differences (28 graphs × 99 participants), the wrong bar was selected only ten times, for a 0.36% error rate. This low error rate is similar to the results of Zacks et al. (1998) (error rates less than 1%). There were no systematic or statistical differences in error rates across dimension, size of difference, or placement (which side had the higher bar).
Time to Select
On average, participants spent about 1.4 seconds per selection across all trials. As expected, the distribution of these times had a strong positive skew. We applied a log transformation on the raw times and used a repeated-measures ANOVA with graph type, difference size, and placement (left or right size higher) as main effects across 28 trials. Findings were comparable on the raw and log-transformed data, so the analyses and graphs show the results for raw mean times. There were no interaction effects, but all three main effects were statistically significant (Dimension: F(1, 98) = 7.6, p = .007; Size of Difference: F(6, 588) = 6.4, p < .0001; Placement: F(1, 98) = 5.9, p = .017).
2D vs. 3D
Overall, selection times for 3D bar graphs were slightly but statistically longer than 2D (t(98) = 2.75, p = .007). It took participants about 6% longer, which is only .08 seconds (2D: 1.38 s; 3D: 1.46 s; 95% confidence interval from .02–.13 s). That difference, while consistent enough to be statistically significant, isn’t necessarily perceptible (e.g., statistically significant but not practically significant).
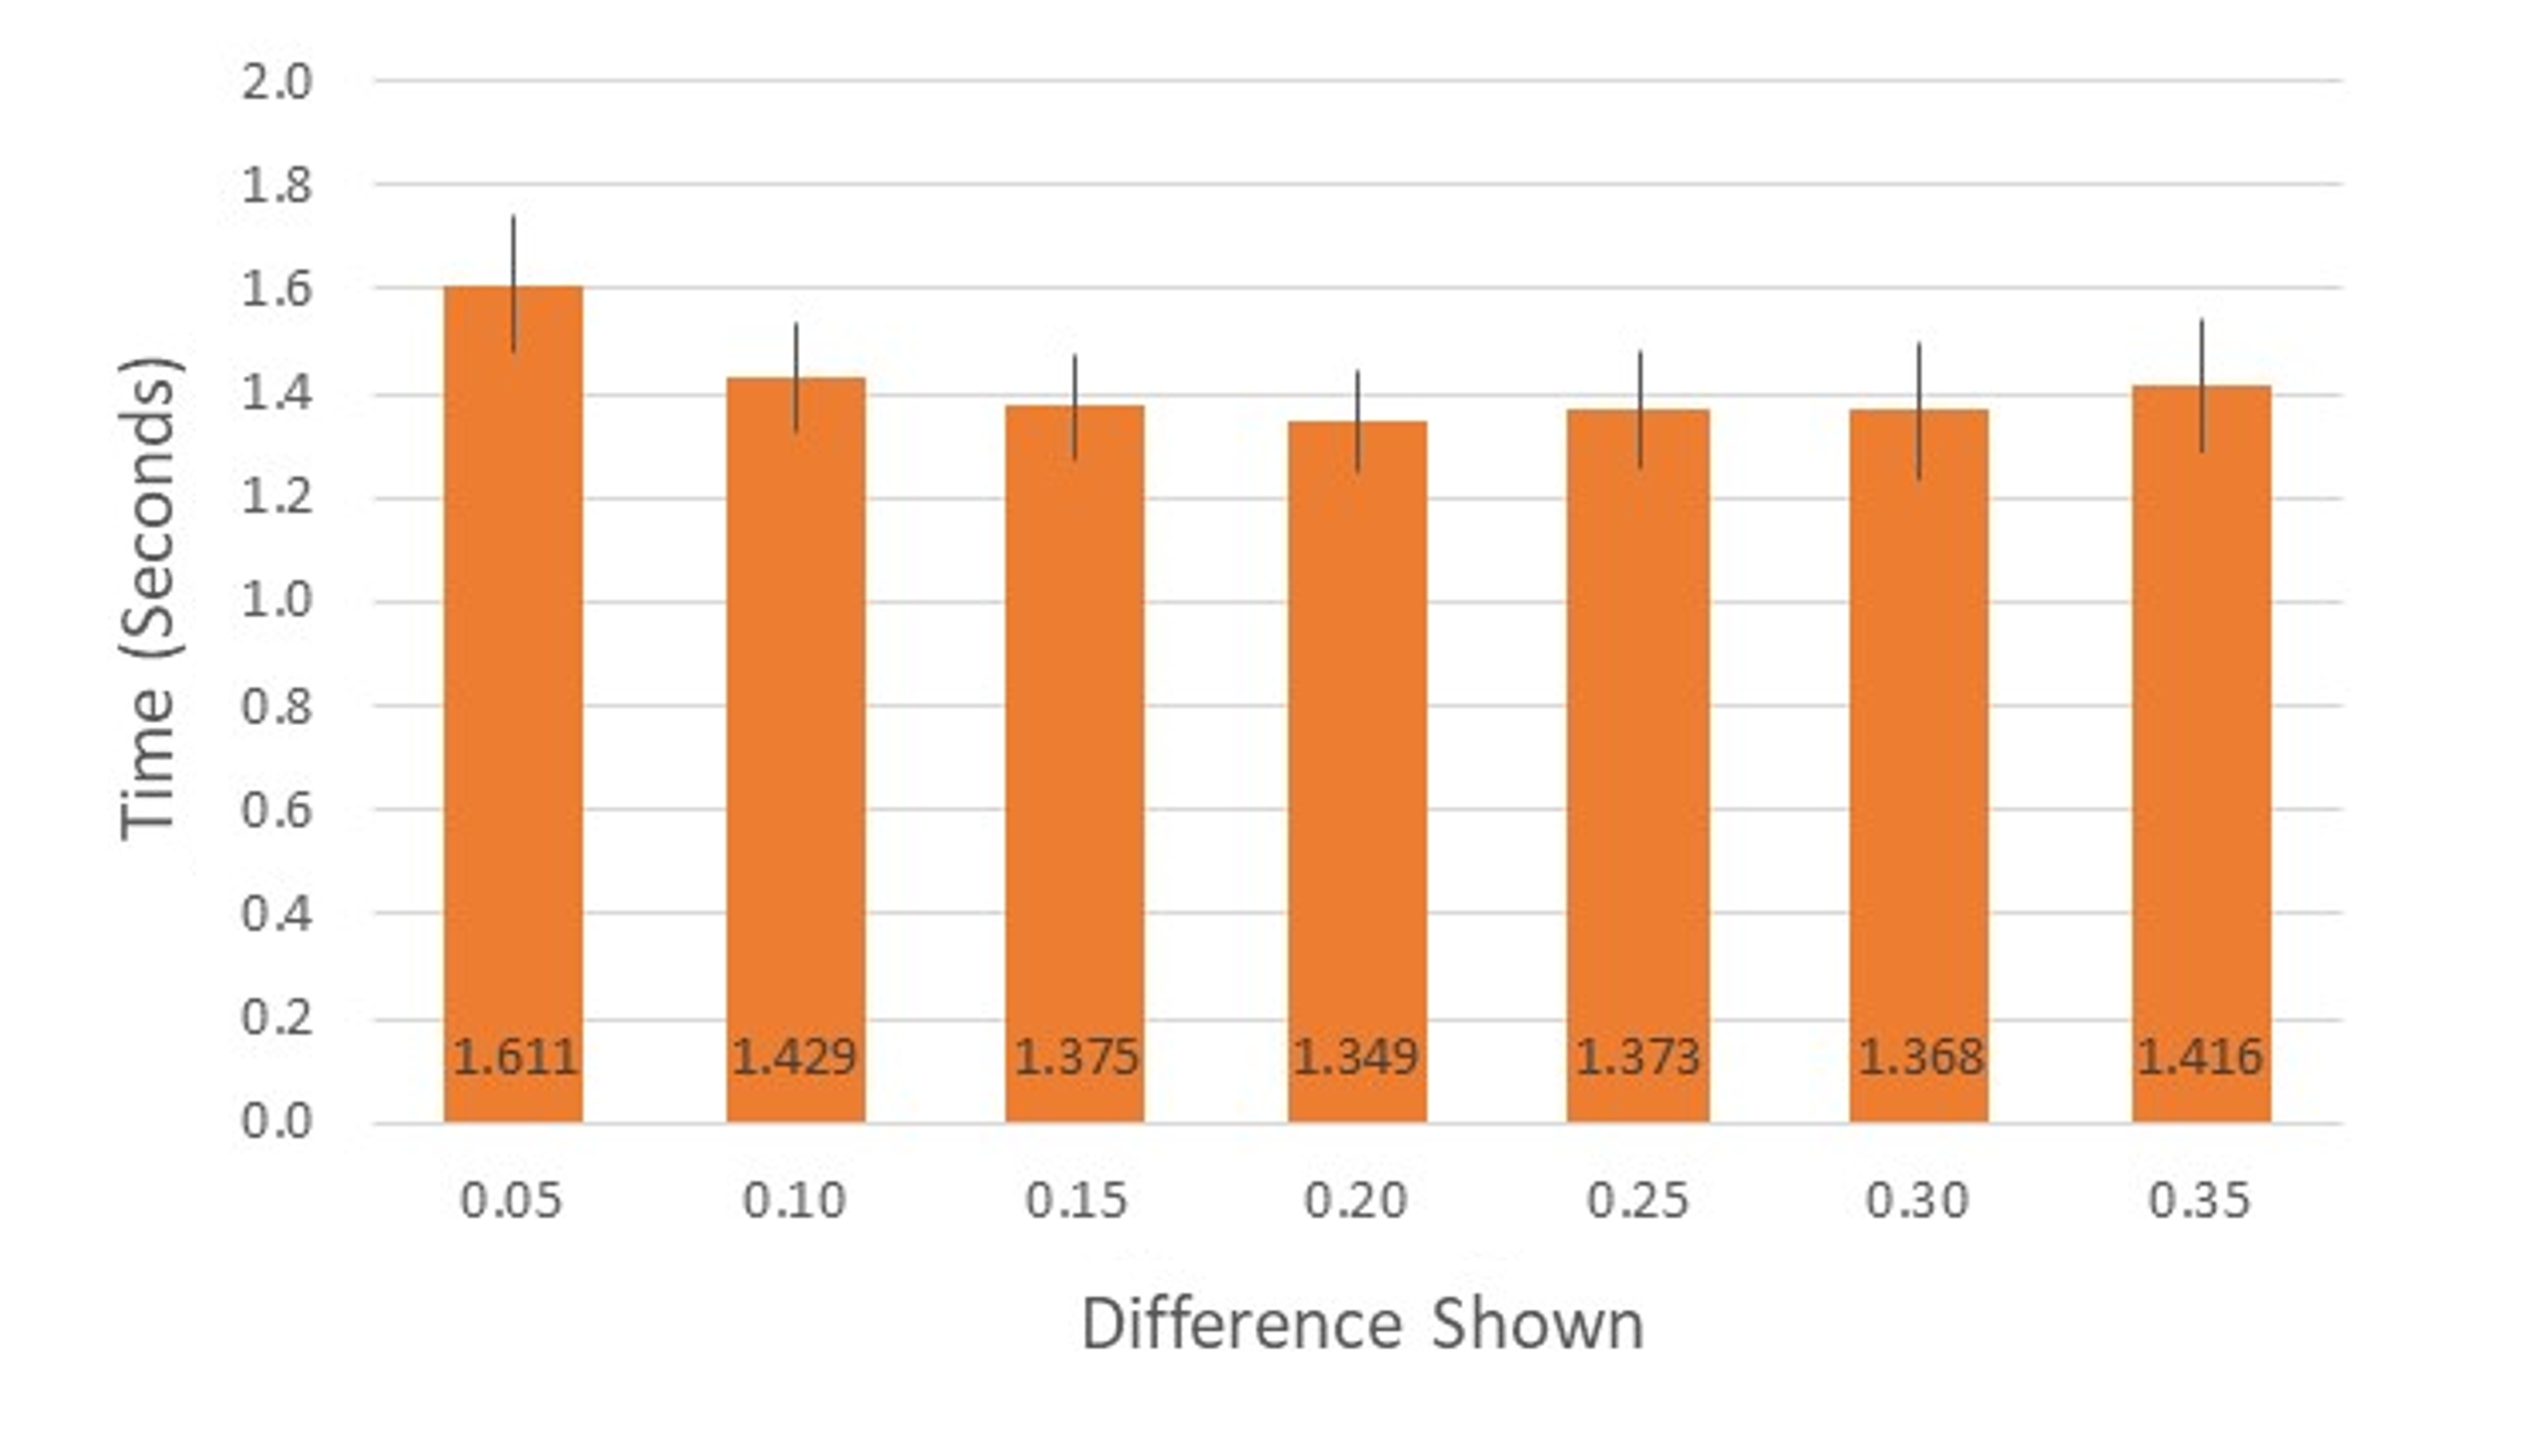
Size of Difference
For both 3D and 2D graphs, the smallest difference (50% vs. 55%) took the longest for participants. Selecting the smallest difference took participants about 12.6% longer (1.6 vs. 1.4 s) compared to the other difference comparisons presented at this level. This was the largest effect we observed in this study (Figure 3).
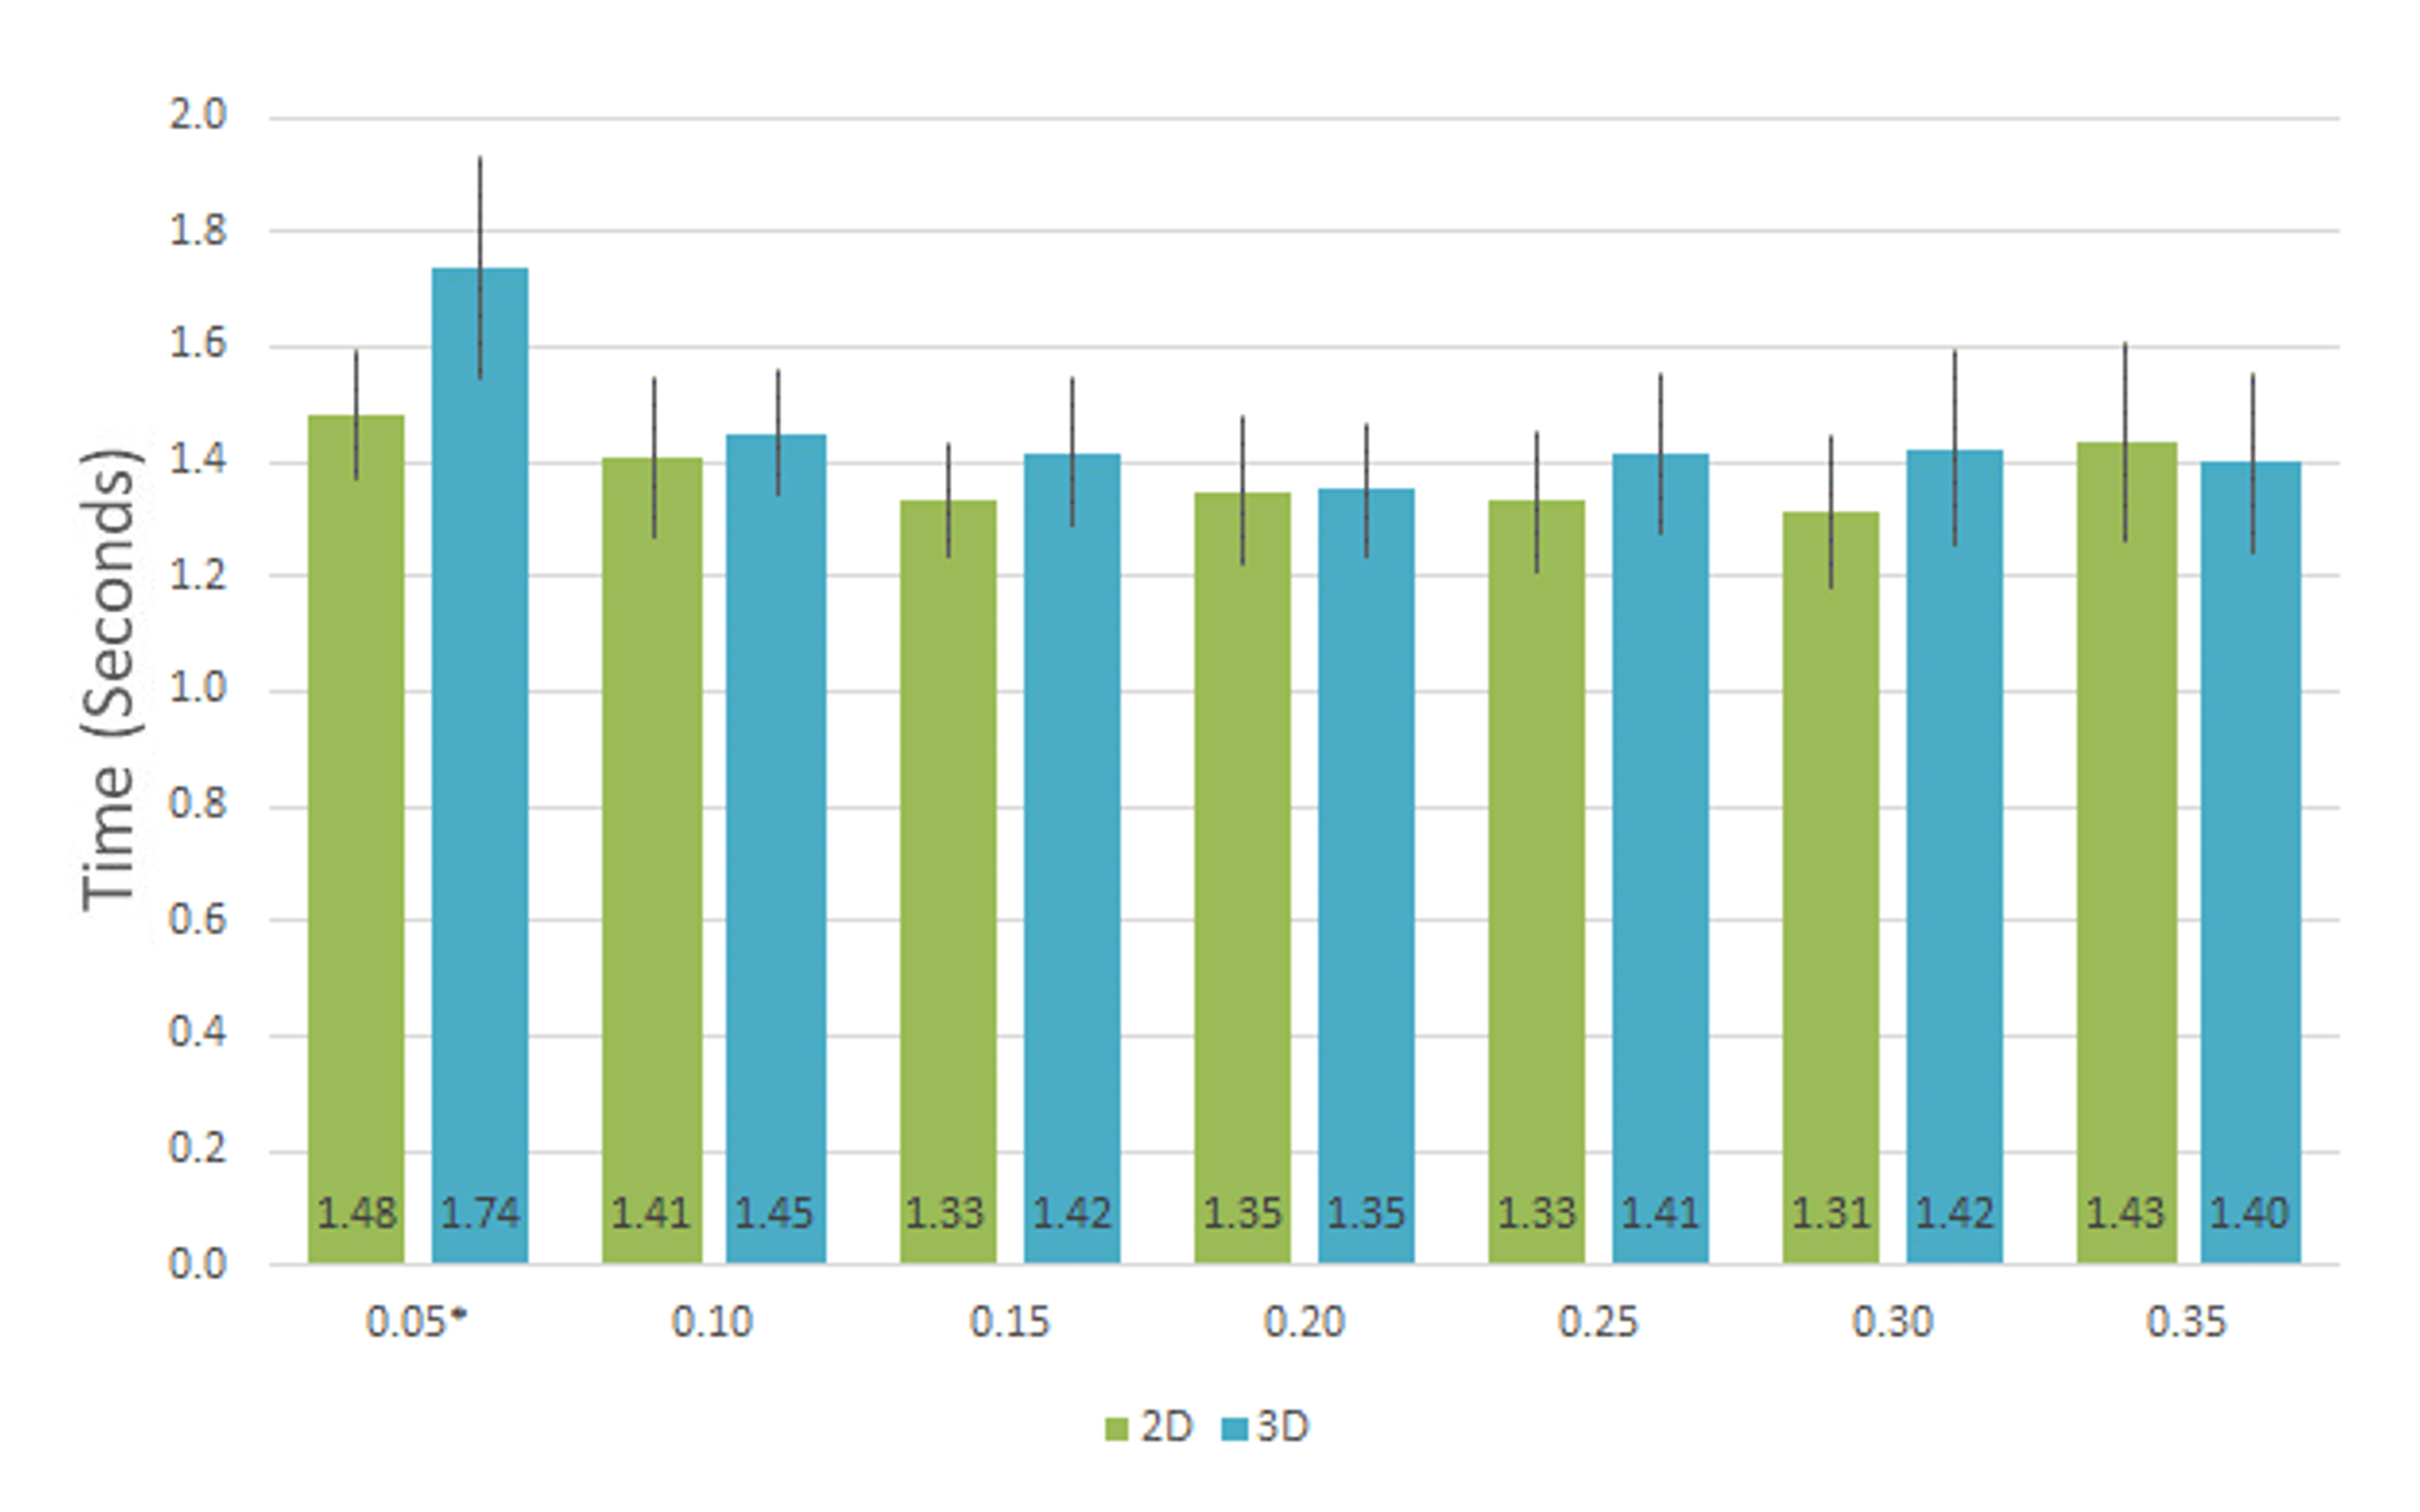
Selection times for 2D and 3D graphs were not significantly different (i.e., no significant interaction) for most differences. However, there was a significant difference in selection times for the smallest difference of .05 (Figure 4; t(98) = 3.0, p = .004; 2D faster than 3D).
Placement (Left vs. Right Side)
Participants made selections about 5% faster when the larger graph was on the left (i.e., closer to the labeled y-axis). This effect, like those for dimension and difference, was statistically significant (t(98) = 2.4, p = .017) but modest (.06 s; Right: 1.39 s; Left: 1.46 s; 95% confidence interval from .01–.10 s).
Control Pairs
In our 2D and 3D control pairs (both values shown as 50%), there was no significant difference in mean times to make a selection (t(98) = .53, p = .60; 2D: 4.1 s; 3D: 4.0; 95% confidence interval around the .01 s difference from −.37–.63 s). However, for both dimensions, participants spent almost three times as long (about 4 seconds) deciding which bar to click when they were the same height. Overall, the clicks were about evenly distributed on the left and right bars.
Preference
For those who had a preference, participants preferred 2D over 3D graphs by a margin of more than 5 to 1 (2D: 66%; 3D: 12%).

When asked to explain their preference, notable comments from participants included:
In favor of 2D
- “2d the angle of 3d made it hard to see the bigger one with close values.”
- “The 2d graphs were just easier to read. As far as looks the 3D looked more modern and \cool\.”
- “I liked the 2D graphs better because I didn’t have to worry about the depth skewing my perception.”
- “I found the 2D graphs much easier to see amounts quickly.”
In favor of 3D
- “3D graphs are easier to see.”
- “I prefer 3D because it’s more involving.”
Discussion and Summary
Our analysis of 99 participants comparing 2D vs. 3D bar graphs found:
There was no difference in selection accuracy. Across 2,772 trials in the experiment, participants selected the wrong bar just ten times (0.36% error rate). The selection task appears to have been simple enough that participants did not need to make a speed-accuracy tradeoff.
3D graphs took slightly longer. When there was a difference in bar height, the overall mean selection time per trial was about 1.4 seconds. There was a slight but significant advantage for 2D (which averaged 1.38 seconds per selection) over 3D (which averaged 1.46 seconds per selection)—a difference of just 0.08 seconds, a barely perceptible period.
Selection was slightly slower for the smallest difference. Selection times were comparable for all differences in bar height except for the smallest (50% vs. 55%), for which there was an unstandardized effect size of 0.20 seconds. This was also the only bar height difference for which 2D (1.48 seconds) was significantly faster than 3D (1.74 seconds, an unstandardized effect size of 0.26 seconds).
Selection on the left was slightly faster than selection on the right. Participants selected bars on the left side of the graph about 0.06 seconds faster than on the right side, possibly due to a tendency to scan from left to right.
There were no statistically significant differences in the control pairs. When there was no difference in bar heights, participants took about four seconds to click a selection. Overall, clicks were about evenly distributed between the left and right bars.
All statistically significant differences in selection time were modest in magnitude. Many of the observed differences, while consistent enough to be statistically significant, weren’t necessarily perceptible or practically significant.
Participants preferred 2D graphs 5.5 to 1. The preferences were 66% for 2D, 22% no preference, and 12% for 3D. For those who had a preference, the margin in favor of 2D was over 5:1.
Limitations and future research: One limitation of this research was that the task was very simple—selecting which bar was higher rather than, for example, having to estimate the magnitude of the height of one bar or the difference between two (where there might be some advantage for 3D representation). In addition to the future research implied by this limitation, we plan to replicate this experimental design replacing the 3D graphs with 1D graphs (vertical lines), and we will expand our stimuli from bar charts to other representations (e.g., pie charts, tables).


