 Capturing someone’s attitude as precisely as possible with as little effort as possible … that’s the goal of post-task metrics collected in usability tests. Organizations devote time and money to testing products with users, not to watching users spend time reading and answering questions. Organizations want to understand if people think an experience is difficult, and if so, what to fix.
We developed and refined the Single Ease Question (SEQ®) specifically because it’s quick to answer (just one question) and easy to administer, and it provides a valid and sensitive measure of people’s attitude towards task ease.
If we could make that metric more sensitive, it would allow us to differentiate between easy and difficult tasks with smaller sample sizes. But what is there left to improve upon?
We know that adding more items can improve precision and sensitivity. But that comes at the cost of adding more participant time.
We also know that changing the response option from a fixed number of points to a sliding scale increases sensitivity. But that comes at a cost because sliders are more difficult for respondents to manipulate.
A promising alternative to sliders is to use images of rating scales. Using the technology of the click test—because it’s like marking a position on a printed line—allows people to make selections between the traditional discrete points in a traditional radio-button rating scale. But how well does it work?
To find out, we compared the responses from a traditionally administered seven-point SEQ with the responses from a click Subjective Mental Effort Questionnaire (SMEQ) across five tasks of varying difficulty. We wanted to know whether we’d get both comparable results (similar mean differences) and higher precision (lower standard deviations).
The SEQ and the SMEQ
The SEQ and the SMEQ are both single-item measures of the effort required to complete a task (i.e., task ease). In a within-subjects comparison of their sensitivities, Sauro and Dumas (2009) found that the SMEQ detected significant differences between ratings of two enterprise expense reporting applications with smaller sample sizes—evidence of better sensitivity.
That version of the SMEQ was designed as a vertical slider scale that ranged from 0 to 150. For this new experiment, we set it up as a “click scale” that produced scores in the same 0–150-point range (Figure 1) and compared it with the standard version of the SEQ (Figure 2).
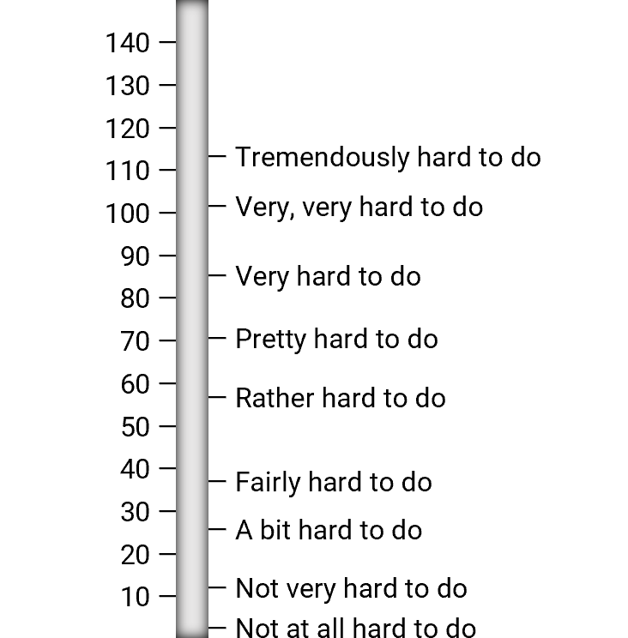
Figure 1: The click version of the Subjective Mental Effort Questionnaire (SMEQ).
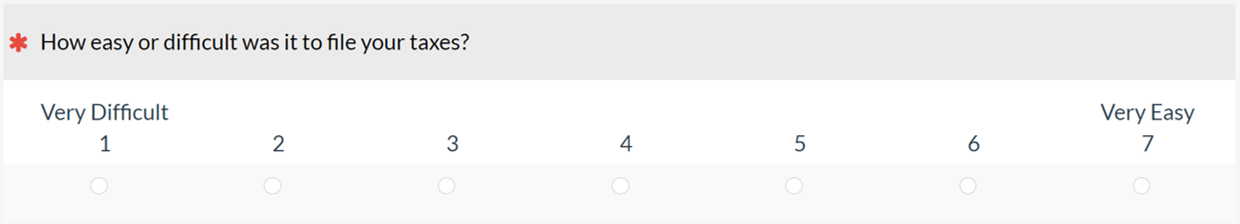
Figure 2: The standard version of the Single Ease Question (SEQ).
Study Details
As part of a larger experiment designed to compare different versions of standard rating scales, we used our MUIQ® platform to collect data from 103 participants sampled from a U.S. panel provider in an unmoderated study in February 2023. In a completely within-subjects experimental design, participants completed five exercises that were a mix of retrospective and task-based activities with varying difficulty, presented in random order (Table 1).
| Task Code | Type | Activity Description |
|---|---|---|
| XFI | Task-based | Imagine you are helping your friend troubleshoot a problem with their cable TV and internet service. Find the Xfinity customer service phone number to call for support. |
| ATT | Task-based | You will be asked to find the monthly cost of an iPhone 14 with a specific plan on the AT&T website. Copy or remember the monthly cost (including all fees). |
| TAX | Retrospective | Reflect on the last time you filed your taxes. |
| SHA | Task-based | One of the numbered figures in the drawing below is more different than the others. What is the number in that figure?" (Note: The fourth figure had six sides while all the others had four.) |
| AMA | Retrospective | Please reflect on your most recent purchase from Amazon.com. |
After each task, respondents provided SEQ and click SMEQ ratings (presented in random order on a task-by-task basis).
Study Results
For this study, our focus was on assessing the relative sensitivity and correspondence between standard SEQ and click SMEQ ratings. To standardize the metrics, we converted all SEQ (seven-point scale) and SMEQ (150-point scale) ratings to a 0–100-point scale where lower scores indicate greater difficulty.
Relative sensitivity of standard SEQ and click SMEQ ratings
Because the standard deviation is a key driver of scale sensitivity, we computed the mean standard deviation of the SEQ and click SMEQ across the five tasks, getting 23.3 for the SEQ and 17.9 for the click SMEQ (76.6% of the standard deviation of the SEQ). As demonstrated in our previous article, keeping all else the same, the sample size needed to detect statistical significance with the click SMEQ would be 58.6% of the sample size needed with the SEQ.
But in this study, it doesn’t look like everything else stayed the same. Specifically, there were differences for the ten possible paired comparisons (t-tests) among the five tasks (Table 2).
| Task 1 | Task 2 | SEQ | SMEQ | SEQ | SMEQ | SEQ | SMEQ |
| AMA | SHA | 9.87 | 6.05 | 4.20 | 3.93 | 15.62 | 23.85 |
| AMA | TAX | 20.87 | 12.45 | 7.71 | 8.00 | 15.79 | 27.49 |
| AMA | ATT | 43.85 | 26.62 | 16.12 | 11.93 | 22.65 | 27.61 |
| AMA | XFI | 72.17 | 53.33 | 23.11 | 21.39 | 25.30 | 31.69 |
| SHA | TAX | 11.00 | 6.40 | 3.67 | 3.30 | 19.68 | 30.39 |
| SHA | ATT | 33.98 | 20.57 | 10.15 | 8.08 | 25.83 | 33.97 |
| SHA | XFI | 62.30 | 47.28 | 18.56 | 17.22 | 27.86 | 34.06 |
| TAX | ATT | 22.98 | 14.17 | 6.42 | 5.16 | 27.87 | 36.31 |
| TAX | XFI | 51.29 | 40.88 | 13.98 | 14.30 | 29.02 | 37.25 |
| ATT | XFI | 28.32 | 26.71 | 7.52 | 8.58 | 31.60 | 38.19 |
| 35.66 | 25.44 | 11.14 | 10.19 | 24.69 | 32.39 | ||
If the only differences in play for these analyses were in the standard deviations of the comparisons (overall 35.66 for SEQ, 25.44 for click SMEQ), then the expectation would be that the values of t for SEQ analyses would be smaller than those for the click SMEQ.
Across the ten comparisons, however, the mean of t for SEQ comparisons (11.14) was a little higher than the click SMEQ mean (10.19). This could happen only if there was a lack of correspondence between the SEQ and click SMEQ ratings in which the magnitude of differences measured with the SEQ were consistently higher than those measured with click SMEQ (which they were—SEQ: 35.66, click SMEQ: 25.44—a SMEQ/SEQ ratio of 71.3% acting as a counterweight to the SMEQ/SEQ standard deviation ratio of 76.6%).
Correspondence between SEQ and click SMEQ ratings
Investigations of standardized UX measures have often (but not always) found substantial correspondence when placed on a common 0–100-point scale. For example, Lah et al. (2020) reported high levels of correspondence between System Usability Scale (SUS) and UMUX-LITE scores, and Lewis (1999) reported correspondence between Computer System Usability Questionnaire (CSUQ) and SUS scores.
Metrics correspond when they (1) correlate highly and (2) have similar magnitudes when collected in similar contexts. Table 3 shows the correlations between SEQ and click SMEQ scores for the five tasks, and Figure 3 shows their magnitudes.
| Task | Correlation |
|---|---|
| XFI | 0.881 |
| ATT | 0.814 |
| TAX | 0.803 |
| SHA | 0.803 |
| AMA | 0.683 |
| Mean | 0.805 |

Figure 3: Magnitudes of SEQ and click SMEQ scores for the five tasks (95% confidence intervals, all SEQ/SMEQ pairs significantly different, p < .001).
The correlations between SEQ and click SMEQ were all statistically significant (p < .0001) and mostly greater than .800. The exception was the correlation for the Amazon task (AMA), which appeared to be reduced by range restriction because the ratings with both metrics were so high.
Examination of the lengths of the margins of error for the 95% confidence intervals in Figure 3 had the expected pattern given the smaller standard deviation for the click SMEQ (Table 4). The margin of error was always larger (less precise) for the SEQ. The mean margin of error for click SMEQ divided by that for SEQ was 3.22/4.42 = 72.8%—in the same ballpark as the ratio of their overall standard deviations (76.6%).
| Task | SEQ | SMEQ |
|---|---|---|
| XFI | 5.62 | 4.78 |
| ATT | 5.05 | 4.41 |
| TAX | 4.64 | 2.91 |
| SHA | 4.45 | 3.07 |
| AMA | 2.36 | 0.92 |
Unfortunately for the hypothesis of correspondence between the metrics, for all five tasks, the SEQ and click SMEQ scores were significantly different (p < .001). The click SMEQ scores were always higher than the corresponding SEQ scores, and the magnitude of the differences decreased as tasks became easier (Figure 4), suggesting that respondents were more willing to give very low scores with the SEQ than with the click SMEQ. Consequently, the range of the SEQ across the five studies was 90.9 − 18.8 = 72.1 (using almost three-quarters of the possible range), while the range of the click SMEQ was 94.3 − 40.9 = 53.4 (just over half of the possible range).

Figure 4: Score differences (click SMEQ minus SEQ) for the five tasks (95% confidence intervals).
For estimating values, these results are consistent with the expected effect of differences in standard deviations. The story is a bit more complicated for the comparison of means because there were systematic differences in respondent behavior for the SEQ and click SMEQ items.
Discussion
What might account for those systematic differences in respondent behavior? A few differences come to mind:
- The SMEQ has numerous labels between the endpoints, but the SEQ does not.
- Respondents click on one of seven radio buttons for the SEQ but click anywhere on the SMEQ image.
- The topmost label of the SMEQ is well below the top of the SMEQ scale, but both the lower and upper SEQ endpoints are at the SEQ scale limits.
- The SEQ and SMEQ numeric scales are very different formats. The SEQ scale is horizontal, with lower numbers on the left and higher numbers indicating an easier experience, and the SMEQ scale is vertical, with lower numbers at the bottom and higher numbers indicating a more difficult experience.
We have found only modest differences due to the orientation of labels (left-side or right-side bias), so while we don’t have specific information about an effect from values representing a poor experience being placed at the top, we suspect it would be small.
In upcoming studies, we will investigate what happens (1) when the interior labels of the click SMEQ are removed and (2) when respondents rate tasks with a click version of the SEQ.
For a quick assessment of the potential effect of placing the top endpoint of the SMEQ below the top of the scale, see Figures 5 and 6.
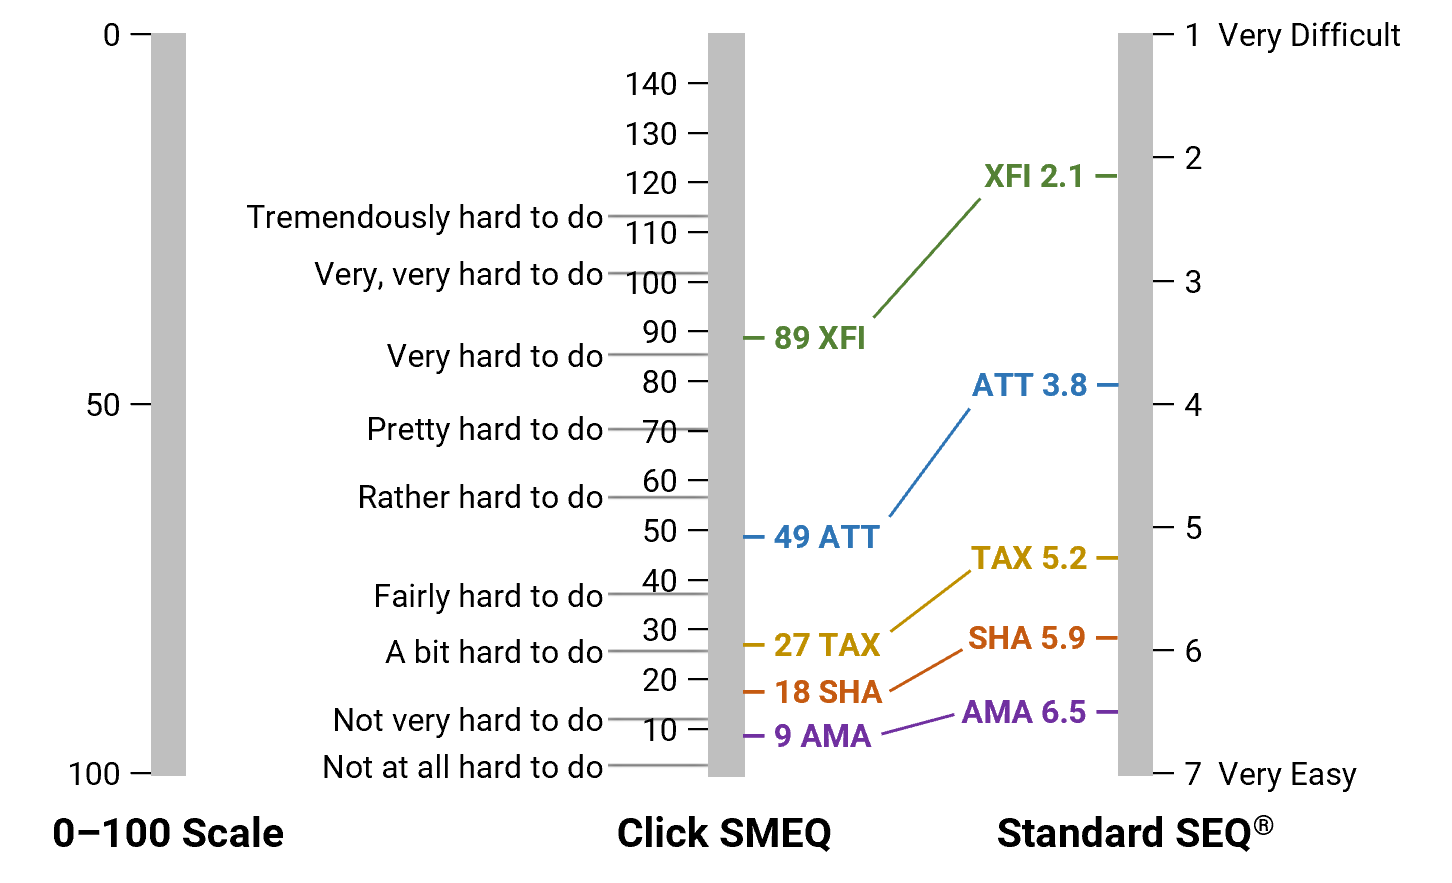
Figure 5: Alignment of SEQ and click SMEQ scores for the five tasks (full range of SMEQ).

Figure 6: Alignment of SEQ and click SMEQ scores for the five tasks (partial range of SMEQ).
Figure 5 illustrates the misalignment of SEQ and click SMEQ scores when scaled using the full range of the SMEQ. But an examination of the location of the click SMEQ means by its interior labels suggests potentially closer correspondence. For example, the most difficult task (XFI) had a mean SEQ of 2.1, placing it close to the endpoint of Very Difficult, while its mean SMEQ was 89, placing it just above Very Hard to Do. The second most difficult task (ATT), with a SEQ mean of 3.8, was just below the midpoint of the scale while its mean SMEQ was 49, between the SMEQ labels of Rather Hard to Do and Fairly Hard to Do. The SEQ mean of the easiest task (AMA) was 6.5, close to the Very Easy endpoint, and its SMEQ mean was 9, between Not Very Hard to Do and Not at All Hard to Do.
Figure 6 shows the improvement in alignment of SEQ and SMEQ scores after removing the large portion of the SMEQ scale above Tremendously Hard to Do and stretching the scale to match the endpoints of the SEQ. This suggests that the format of the SMEQ discourages respondents from making selections above Tremendously Hard to Do. For the most difficult task in the study (XFI), 17 of the 103 respondents (16.5%) clicked above Tremendously Hard to Do.
Figure 7 shows the correspondence between SEQ and click SMEQ means for the five tasks after rescaling the SMEQ scores using 115 (just over Tremendously Hard to Do) as the SMEQ value aligned with 100 on the reversed 0–100-point scale. The SMEQ–SEQ differences for each task were still statistically significant (XFI: p = .006, ATT: p < .0001, TAX: p < .0001, SHA: p = .01, AMA, p = .08), but the differences were much smaller (XFI: d = 4.2, ATT: d = 10.7, TAX: d = 6.2, SHA: d = 3.5, AMA: d = 1.6).
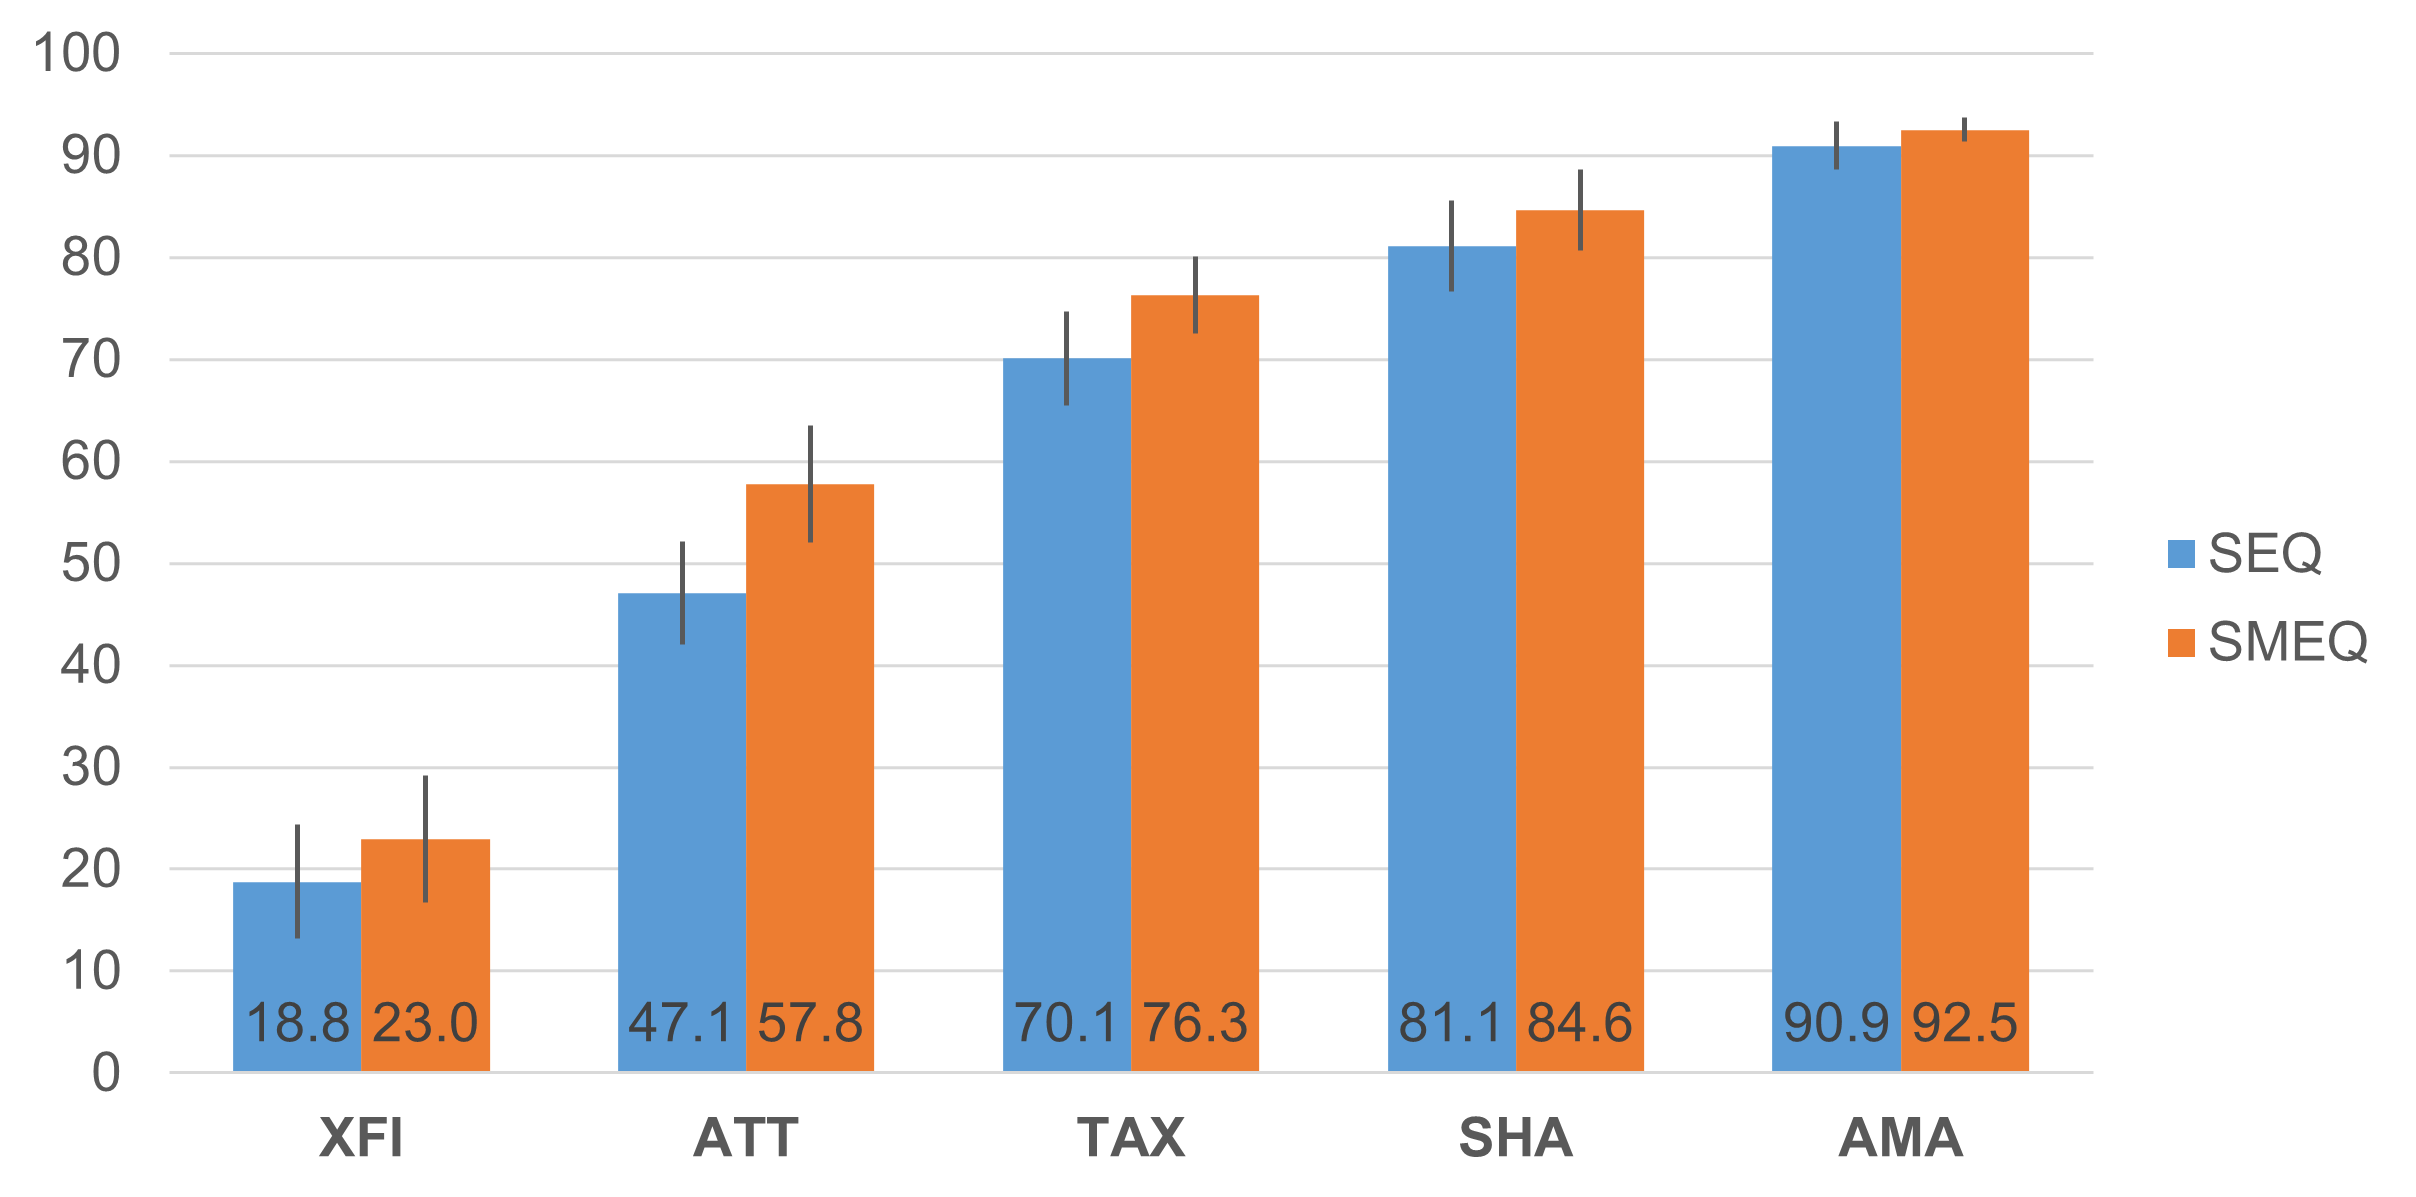
Figure 7: Magnitudes of SEQ and click SMEQ scores for the five tasks after rescaling the SMEQ (95% confidence intervals).
This rescaling also increased the mean standard deviation of the click SMEQ across the five tasks from 17.9 (when reducing the 0–150-point scale to 0–100) to 23.3 (when reducing 0–115 points to 0–100) and increased the SMEQ range across the five tasks from just over 50% to just under 70% (92.5 − 23.0 = 69.5)—the same standard deviation as the rescaled SEQ and just a bit less than the SEQ range.
All these analyses suggest that the placement and extreme wording of the top SMEQ label (Tremendously Hard to Do) affects how respondents use it to rate experiences so that much of its scale range goes unused in practice, at least for the range of difficulty of the tasks used in this study. That might or might not be problematic for researchers who are thinking about using the SMEQ. When researchers need a scale that can discriminate among very difficult tasks, the SMEQ could be the better choice. For most UX research, however, the SEQ is probably the better choice due to how easy it is to employ in studies, how easy it is for respondents to mark their selection, and how well it discriminates perceptions of ease across a wide range of task difficulty.
Summary
Based on data from 103 participants who rated five online tasks of varying difficulty (two retrospective and three task-based), our key findings were:
SEQ was slightly more sensitive. After rescaling the full ranges of the SEQ and click SMEQ to 0–100-point scales, the SEQ was slightly more sensitive at detecting differences among tasks. The SMEQ had a slight advantage in the precision of estimated means due to its lower standard deviation, but the SEQ had a slight sensitivity advantage when comparing task means due to its larger mean differences.
The SEQ and SMEQ scores didn’t align as closely as expected. The correspondence between SEQ and click SMEQ scores was mixed. SEQ and click SMEQ scores correlated highly (mean r > .800), but there were large and significant differences in the magnitudes of the scores across the five tasks, especially when tasks were difficult.
Rescaling the SMEQ improved the correspondence with SEQ means. Using 115 rather than 150 as the point of alignment for rescaling the SMEQ due to its proximity to the most extreme scale label (Tremendously Hard to Do) and how infrequently respondents chose a value above it brought the resulting SMEQ scores into closer correspondence with SEQ means across the five tasks, which increased the range of the scale from most to least difficult tasks but also increased its standard deviation to be the same as that of the rescaled SEQ.
Key takeaway: Unless there is a need to discriminate among very difficult tasks, UX researchers should use the SEQ rather than the SMEQ.