 While they may be called customers, users, buyers, or even guests, they are all people.
Organizations quantify, classify, categorize and track people well before they’ve even made a purchase and throughout their customer lifetime.
These analytics provide a constant stream of data that should improve the decision making process.
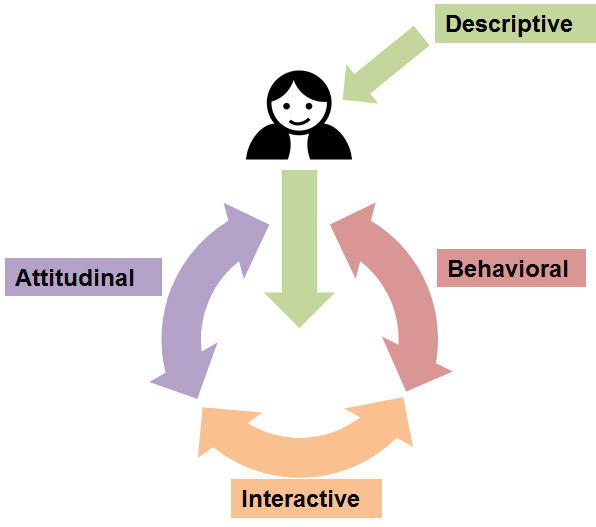
To get a better understanding of problems and opportunities for your customers, you’ll want to collect data from each of the following four customer analytics groups.
Descriptive : This includes demographic data like gender, age, geography and income. It also includes self-described attitudes and preferences toward products categories and technology. From this data you can create meaningful segments (e.g. early adopters or value-seekers) and personas. You can collect this data from purchases, registrations, surveys, interviews and contextual inquires.
Behavioral : These are the general patterns customers exhibit when using your products and services. It includes making purchases, registering, browsing, and using difference devices. For example, we’ve found that customers of certain product categories, like consumer electronics or home-furniture, will tend to browse products on their tablet at night and make purchases on their desktop during the day.
Interaction: This includes the clicks, navigation paths and browsing activities found on websites and software. The classic usability test typically focuses on this level of granularity by simulating real interactions. You can use real time data from A/B testing, Google Analytics and lab based or unmoderated testing to collect data for this grouping.
Attitudinal : Preference data, opinions, desirability, branding and sentiments are usually captured in surveys, focus groups and usability tests. This is where questionnaires like the SUPR-Q, SUS or the Net Promoter Score quantify how interactions and behaviors affect attitudes. These attitudes will then affect some self-described descriptive attributes quantified in the descriptive grouping.
The nifty diagram below illustrates the relationship between these different customer analytics groups.
Icon Credit to Venkatesh Aiyulu from The Noun Project
The descriptive data becomes the template for who you measure. The behavioral data becomes the framework for testing. The interaction data becomes the task-scenarios that you simulate and measure during a usability test. Improvements in the interactions affect attitudes and the attitudes, like increased trust and loyalty, drive further buying behavior.
Of course collecting data from each of these groups in only the first step. Collecting metrics is only worthwhile if something is done about the findings.


