 In Quantifying the User Experience, we recommend using a mix of task-level and study-level metrics, especially in benchmarking studies. But what, exactly, are task-level and study-level metrics, how do they differ, and why should you collect them both?
In this article, we’ll explore this common practice of collecting both types of metrics to understand the rationale and potential benefits of collecting data at different levels of granularity in a UX study.
First, we’ll review what we mean by task-level and study-level metrics.
Task-Level Metrics
One defining characteristic of a usability test is the use of tasks. Tasks involve a representative user attempting to accomplish a goal, such as finding a movie to stream, selecting a product to purchase, or reserving a hotel room.
Tasks can be used to help uncover usability problems, suggesting what needs to be improved in an interface. But the result of the task itself can become a good metric to track. If users can’t reach common goals in an interface, then not much else matters.
Consequently, task-completion rates are one of the most common task-level metrics. But just because a user can complete a task doesn’t mean the experience is necessarily usable.
You can probably recall an experience you struggled with, such as filling out a lengthy registration form or finding a specific product in a byzantine mix of product pages. You may have technically completed the task, but it’s hardly a great—or even acceptable—user experience. In short, task completion is a necessary but insufficient metric to describe the task experience.
Additional metrics are then used to quantify task experiences. Did it take too long? Task time is the quintessential measure of efficiency. Or maybe it didn’t take too long, but it was unnecessarily complicated. A post-task measure of perceived ease such as the Single Ease Question (SEQ®) succinctly captures this sentiment immediately after the experience.
Additional task-level metrics—for example, the number and type of errors, clicks, or requests for help—can also be used to describe the experience. Task-level metrics can also be aggregated using a metric like the Single Usability Metric (SUM).
But task metrics alone can’t fully describe a product, app, or website experience.
Study-Level Metrics
Participants can complete tasks quickly and easily but still think the product isn’t usable.
Study-level metrics allow users to reflect upon a product experience more broadly than in a task scenario. Even the most comprehensive study or benchmark can usually only capture the surface of what many users do with an interface. Study-level metrics include a mix of overall usability, satisfaction, and perceived usefulness.
They are called study-level metrics because they are typically asked only once in a study (unlike task metrics, which are collected for each task attempt).
Common study-level metrics include the SUS, SUPR-Q®, UX-Lite™, satisfaction, and Net Promoter Score.
Study-level metrics can also be used without tasks to gauge the perception of the experience in retrospective benchmarking studies.
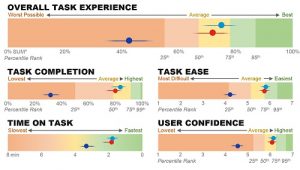
Both can be presented together in a scorecard such as the example in Figure 1.

Why Use Both Metric Types?
Here are the reasons why we recommend you collect both task- and study-level metrics where possible:
Task- and study-level metrics correlate but aren’t redundant. In our earlier comprehensive analysis of UX metrics, we found that study-level metrics and task-level metrics have a modest to strong correlation (see Table 1). While the correlations suggest there’s an overlap in what’s being measured, it’s not so strong that one is a substitute for another. For example, Table 1 shows that the strongest correlation (r = .64) we found was between post-task measures of ease (Task-Sat) and post-test studies (Study-Sat) of satisfaction (typically the SUS). The correlations of Study-Sat with completion rates, time, and errors were more modest (absolute magnitudes of r from .16 to .25).
| Comp | ||||
| Time | −0.46 | Time | ||
| Errors | −0.54 | 0.6 | Errors | |
| Task-Sat | 0.51 | −0.47 | −0.44 | Task-Sat |
| Study-Sat | 0.24 | −0.25 | −0.16 | 0.64 |
Table 1: Correlation between typical UX metrics, adapted from Table 12 in Sauro and Lewis (2009).
Task-level metrics quantify the behavior of the task experience. If your study has tasks, you’ll want to capture the more behaviorally focused metrics such as completion rate, time, and perceived ease immediately after the attempted task. The lower correlations between study-level metrics such as the SUS and task-level metrics indicate that study-level metrics are capturing on average only 3% to 6% of the variability for the observational data of completion rates, time, and errors and 41% of post-task ease.
Task-level metrics tend to be more diagnostic. While study-level metrics may tell you how the product is perceived (high, medium, low), they tend to not be terribly diagnostic. With a low SUS score, what do you fix? A task with a low completion rate will allow you to hone in on the functionality encountered for the scenario. In other words, low metrics at the task level allow for quicker diagnosis.
Study-level metrics assess a more holistic attitude toward the product. The modest correlations between metrics shouldn’t be interpreted as study-level metrics doing a poor job of capturing task experiences. They should be interpreted as study-level metrics measuring something tasks aren’t. And that something they are measuring is typically broader attitudes from prior experience about the product that the tasks didn’t capture.
Study-level metrics are likely more generalizable than task metrics. The broader and more holistic attitudes captured by post-study measures such as the SUS, SUPR-Q, and UX-Lite allow you to easily compare scores between different types of studies. If you’re running a retrospective benchmark by surveying existing users, you can compare the post-study scores such as the SUS to other task-based studies.


