 Online dating websites are one of the primary ways people find dates and even future spouses. These sites represent the bulk of a 3 billion dollar dating services industry.
In fact, around 30% of recent marriages started online, but it’s not like finding a date is as easy as filtering choices on Amazon and having them delivered via drone the next day (not yet at least).
Dating can be hard enough, but in addition to finding the right one, you also have to deal with things like Nigeria-based scams (and not the one with the Prince!).
Even when someone’s not directly trying to steal your money, can you really trust the profiles? By one estimate, over 80% of profiles studied contained at least one lie (usually about age, height, or weight).
Online dating isn’t all bad though. There is some evidence that the online dating sites actually do lead to marriages with slightly higher satisfaction and slightly lower separation rates. It could be due to the variety of people, those mysterious algorithms, or just a self-selection bias.
To understand the online dating user experience, we conducted a retrospective benchmark on seven of the most popular dating websites.
- eHarmony (www.eharmony.com)
- Hinge (mobile app)
- Match.com (www.match.com)
- OkCupid (www.okcupid.com)
- Plenty of Fish (www.pof.com)
- Tinder (www.tinder.com)
- Zoosk (www.zoosk.com)
Full details are available in the downloadable report. Here are the highlights.
Study and Participant Details
We asked 380 participants who had used one of the seven dating websites in the past year to reflect on their most recent experience with the service.
Participants in the study answered questions about their prior experience, and desktop website users answered the 8-item SUPR-Q and the Net Promoter Score. In particular, we were interested in visitors’ attitudes toward the site, problems they had with the site, and reasons they used the website.
Measuring the Dating Website UX: SUPR-Q
The SUPR-Q is a standardized measure of the quality of a website’s user experience and is a good way to gauge users’ attitudes. It’s based on a rolling database of around 150 websites across dozens of industries.
Scores are percentile ranks and tell you how a website experience ranks relative to the other websites. The SUPR-Q provides an overall score as well as detailed scores for subdimensions of trust, usability, appearance, and loyalty. Its ease item can also predict an accurate SUS equivalent score.
The scores for the six dating websites (excluding the Hinge app) in the perception study were below average at the 43rd percentile (scoring better than 43% of the websites in the database). SUPR-Q scores for this group range from the 19th percentile (Plenty of Fish) to the 69th percentile (eHarmony).
Distrust and Disloyalty
The top improvement area for all the dating websites was trust. Across the websites, the average trust score was in the 23rd percentile. Participants express highest trust toward eHarmony—but trust scores were still only slightly above average (54th percentile). Plenty of Fish had the lowest trust score (5%), followed by Tinder (10%). These lower trust scores were consistent with the studies we found that cite false information and even scams.
The NPS reflects trust scores. eHarmony, the most trusted website, was also the most likely to be recommended with an NPS of 11% while the least trusted site, Plenty of Fish, had the lowest NPS (-46%). Overall, the average NPS score was a paltry -23%.
High Mobile App Usage
Not surprisingly, mobile app usage for dating services is high. 77% of participants reported visiting a dating service using a mobile app while only 61% said they log on using a desktop or laptop computer.
Most participants reported visiting their dating website on a desktop or laptop computer a few times per year, while mobile app users said they log on a few times a week or a few times a month. 19% of Match.com participants reported using the mobile app as much as once a day.
“The app is definitely more easy to use and intuitive, while the website seems more like an afterthought.” —Tinder user
“It’s one of the few instances of ‘websites turned into apps’ that I actually find value in.” —OkCupid user
Across the dating services, over half of participants reported they were looking for a serious relationship and just under half said they were looking for a casual relationship.
Reasons to use the dating services were similar for the website and app, except 42% of desktop website users said they are looking for a friendship while only 29% of mobile app users are looking for friends. Interestingly, this was a statistical difference.
Most Lack Dating Success
While over half of participants reported visiting dating sites to find a serious relationship, only 22% said they’ve actually found a relationship through the service. Specifically, OkCupid and Tinder users had the highest dating success in the group; 35% of OkCupid and 30% of Tinder users reported finding a relationship through the service.
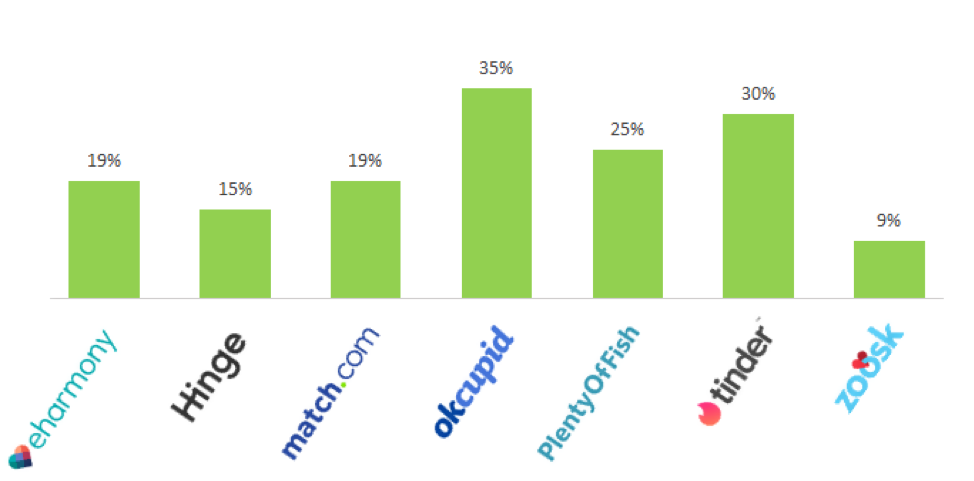
Figure 1: Percent of respondents by site who report being in a relationship with a person they met on the website or app in the last year.
“I liked answering a lot of questions which would increase the match percentages I’d be able to find.” —OkCupid user
Only 9% of Zoosk users said they have found a relationship using the service. Zoosk users’ top issues with the site were dishonest users and fake profiles, poor matches, and active users who don’t respond.
“May not be great for a serious relationship.” —Zoosk user
“I keep getting referrals that are far outside my travel zone.” —Zoosk user
Dating Scams and Dishonest Users
Participants reported worrying about dishonest users and scams. On average, only 33% agreed that other users provide honest information about themselves and 41% said they are afraid of dating scams. These were the top issues reported by OkCupid and Plenty of Fish users.
“There are tons of fake/spam profiles.” —OkCupid user
“More scams than anything.” —Plenty of Fish user
“There are many suspicious profiles that seem like catfishing.” —Plenty of Fish user
Providing honest information on the site was found to be a significant key driver and explains about 17% of the dating site user experience. Other key drivers included brand attitude (22%), nicely presented profiles (10%), ease of creating and managing profiles (9%), intuitive navigation (9%), and ease of learning about other people (8%).
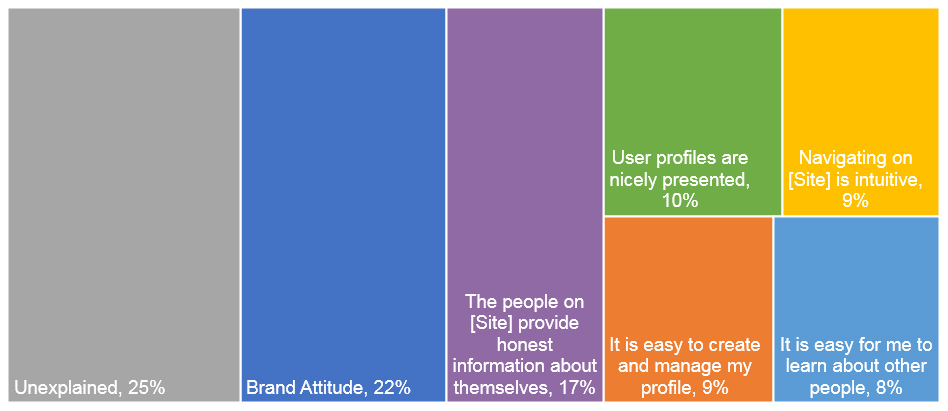
Figure 2: Key drivers of the online dating website user experience (SUPR-Q scores).
Together, these six components are key drivers of the dating website user experience and account for 75% of the variation in SUPR-Q scores.
Safety and Protection Resources
Across the dating services, 18% of participants reported having an issue with another user in the past. Plenty of Fish had the highest instance of issues with other users at 40%; however, 74% of those participants said there were resources available on the site to deal with this.
“I blocked the person because he was being very disrespectful.” —Plenty of Fish user
“I blocked the person who was harassing me.” —Plenty of Fish user
Using a dating service comes with obvious safety concerns and it’s felt by a fair number of users. Across the websites, only 54% of participants agreed that they feel safe using the site. Tinder had the lowest agreement to this item, only 38%.
“There is not more protection from the terrible men that are on there.” —Plenty of Fish user
“They do not seem to screen out people with criminal backgrounds. Found local sex offenders in this app. It is also difficult to unsubscribe.” —Plenty of Fish user
“Somebody posted improper material in profile and I reported it to admin.” —OkCupid user
Plenty of Fish had the highest rate of unwanted images, with 61% of women reporting at least one unwanted image compared to 35% of men. eHarmony and Tinder had similar but slightly lower unwanted image rates.
Poor Matching Algorithms
While the right algorithm can help create a match, participants reported algorithms often fell short. Less than half of participants on Match.com, Plenty of Fish, Tinder, and Zoosk agreed with the statement “the site is good at matching me with people” and only 14% of Tinder users said the site asks meaningful questions about users.
“Sometimes it’s hard to sort the matches by compatibility.” —Match.com user
“I find that its match system doesn’t help a great deal in finding whether someone is well suited for you, and it is rather glitchy, with people appearing after thumbing them down.” —OkCupid user
“Poor quality of fish on the site.” —Plenty of Fish user
Full details are available in the downloadable report.
Summary
An analysis of the user experience of seven dating websites found:
- Dating is hard; the user experience is probably harder. Current users find the dating website experience below average, with SUPR-Q scores falling at the 43rd percentile. eHarmony was the overall winner for the retrospective study at the 69th percentile, with Plenty of Fish scoring the lowest at the 19th. The top improvement area across the sites was trust. eHarmony also had the highest NPS (11%) while Plenty of Fish had the lowest (-46%).
- Participants prefer using mobile apps. 77% of participants reported using the dating service mobile app. The majority of participants reported visiting the dating services a few times per week on their mobile device. 19% of Match.com users said they use the app every day. Participants reported using the app more frequently than the website for each of the dating services.
- High hopes with modest success. Over half of participants reported visiting dating sites to find a serious relationship, but only 22% said they have found a relationship through the service. Specifically, OkCupid and Tinder had the highest dating success; 35% of OkCupid and 30% of Tinder users reported finding a relationship. Only 9% of Zoosk users said they found a relationship using the site.
- Users are concerned about dating scams and dishonest users. Participants reported worries regarding scams on the dating sites. On average, only 33% agreed that other users provide honest information about themselves and 41% said they are afraid of dating scams. Providing honest information on the site was found to be a significant key driver and explains about 17% of the dating site user experience.