 We need to increase findability!
We test a lot of home pages and website redesigns and one of the stated goals is usually to increase findability.
By findability, most development teams mean they want users to find things easily and quickly on a website.
But how exactly do you measure findability? There isn’t a findability yardstick and, while you could just ask users to rate the “findability” of a website, there are better ways.
In order to improve findability, you first need to know how findable items on a website are. To do so we use the same core usability metrics to assess how well users can find items.
Step 1: Define What Users are Trying to Find
Identify a good cross-section of products or pieces of information that users would likely look for on the website. While there are often thousands of products, pages and content on most websites, the idea is not to be comprehensive but representative. I’d recommend no more than 30 items. Here are some ideas on how to identify those items.
- Survey Users: Ask users to pick the top five products or things they have looked for on a website.
- Look at search logs: See what users are searching for on the website’s internal search function.
- Look at the Google Analytics key words and traffic logs to see which pages are most visited and what external search words users are using
Step 2: Measure Baseline Findability
Have users try to locate the items using the current website navigation. You can conduct a tree test (reverse card sort) or a standard task-based usability test using software like MUIQ or Loop11.
Part of the reason I recommend less than 30 items is that you can only ask users to look for so much during a study. Even with just one minute per item you’re already at 30 minutes.
Time to Find: If you ask users to locate an item, they assume the item can be found. Otherwise, why would you ask them? This is one of the inherent biases in usability testing. If users eventually find the item but it takes them a long time, then you have a findability issue. To also gain perspective of how consistent the experience was, look at the variability of found item times. Divide the standard deviation by the mean. High values indicate high variability (this metric is called the coefficient of variation).
Difficulty: We use the 7-point Single Ease Question (SEQ) to gauge how hard it is for users to locate items. Because we have hundreds of other tasks to compare the scores to, we can convert mean difficulty ratings into percentile ranks. So, for example, an average score (about a 4.8) becomes 50%. In addition, by associating average found times with difficulty ratings, you can identify items that while able to be found are taking too long to find.
Verbatims: We ask users to pick which items they had the hardest time finding. If they rated an item as relatively hard on the SEQ, we also ask them what they had problems with. These become excellent cues for improvement and help provide the “why” behind the numbers.
Step 3: Improve Findability
There are inevitably some hard-to-find “dogs” in the results that stand out. What items were users struggling with? Look at low findability percentages, high times, high variability, items rated low on ease, and of course examine the verbatim responses to see why users say items are difficult.
It can help to run an open-card sort on items if there are major problems with the navigation. It’s also a no-brainer to add cross-referencing on product category pages. That is, if half the users look for cuff links in Men’s Accessories and half in Men’s Formal Wear, add links in both categories. We are free from the physical constraints of library bookshelves and can place “virtual” products and information in multiple areas.
Sometimes, the issue can be as simple as users didn’t know what they were looking for. For example, on retail sites we know gift cards are popular purchases. In a tree test we conducted on Target.com, the most difficult item to find was the “Iconic Puppy Gift Card $5-$1000.” We pulled this name right from the Target website in the gift card section. However, users were confused if the item was for a $5 puppy or a generic gift card. That’s less of a problem with the website than what we were asking users to do. In reality they probably look for gift cards then select the picture of Target’s dog.
Step 4: Measure After
Here’s where having the baseline data pays off. The reason you know if you made improvements or made things worse is by comparing the findability of the same items over time. Use all the metrics from Step 1 to compare before and after, statistically.
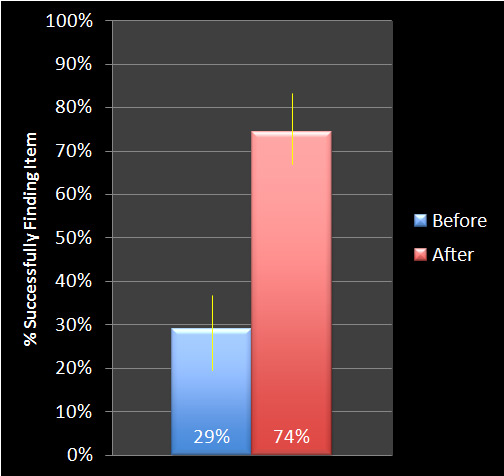
For example, we conducted a tree test on an Internet retailer using just the navigation structure, no design elements. One item of children’s furniture had a very low findability score of 29% in our baseline test. We found that users were split across multiple categories. After adding links to departments where the item could be found, the percentage of users finding the item increased from 29% to 74%.
The graph below shows the 90% confidence intervals for the percent of users who found the item before and after the change. The difference was both statistically significant (p <.01) and practically significant (the findability rate more than doubled!).

Figure 1: Percent of users that successfully located an item of children’s furniture before (29%) and after (74%) improving cross-navigation links.
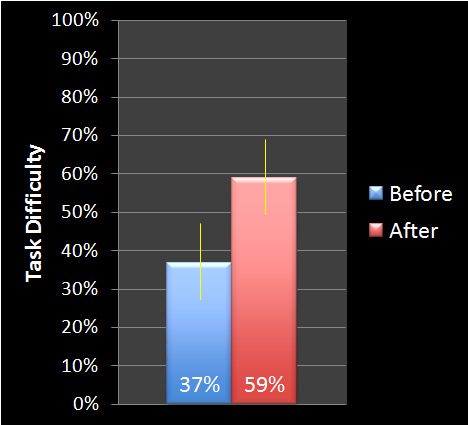
The next graph shows the perceived difficulty of finding the children’s furniture using the SEQ. Higher scores indicate an easier experience finding the item, compared to hundreds of other tasks. Before the findability fixes, the item scored easier than 37% of all tasks. After the change, the perceived ease score was easier than 59% of all tasks in our database (a 60% improvement).

Figure 2: Percentile rank of perceived difficulty as rated using the Single Ease Question for finding an item of children’s furniture before (37%) and after (59%) improving cross-navigation links.
This means that the difficulty of finding the item went from harder than average to easier than average after making the changes.
As with measuring the user experience in general, measuring findability in particular involves multiple metrics and multiple methods to show a quantifiable better navigation.


