 How do you measure tech savviness? Abstract constructs such as usability, trustworthiness, intelligence, and desirability can be difficult to measure. The same applies to tech savviness. But to paraphrase Potter Stewart, we know a tech-savvy person when we see one.
Tech savviness should matter to UX researchers. When we measure an experience, we don’t want those measures to primarily reflect a participant’s tech savviness (or lack thereof).
To separate individual abilities from interface abilities, we need a good measure of tech savviness to use in UX research.
In an earlier article, we reviewed the literature on tech-savvy measures and found at least three approaches to measuring tech savviness: assessing (1) what a person knows, (2) what a person does (or reports doing), and (3) what a person feels (attitudes, especially tech-savvy self-assessments).
We found a clear need for additional research on these or related measures of tech savviness. In particular, metrics based on lists of things people are comfortable doing might work as well as or better than metrics based on quizzes or short attitudinal/self-assessment questionnaires.
So, we started a multi-year research effort to identify a tech-savvy measure to use in UX research. Here’s how the journey started in 2015.
Candidate Items
To develop a measure of tech savviness, we started where most standardized questionnaires start—a pool of candidate items that we felt described what we meant when we say, “tech savvy.” We brainstormed items from the three rubrics (what people know, what people do, and what people feel), informing our ideas with the literature and our own experience working with tech products (and seeing participants struggle).
What People Know
We planned to present these items in a quiz on tech savviness:
- What is Blu-ray?
- What is VoIP?
- What is USB?
- What is a megapixel?
- What is HDTV?
- What is 1080p?
- What is an Ultrabook?
What People Do
We planned to ask participants to self-report which of these activities they feel confident doing:
- Install a printer.
- Diagnose network problems.
- Set up a wireless router.
- Set up a new phone.
- Install new software on a computer.
- Install a new app on your phone.
- Use Excel formulas.
- Create a PowerPoint presentation.
- Set up voicemail.
- Understand and use HTML.
- Program efficiently in a language (e.g., Java, C).
- Program a universal remote control.
- Detect and remove a virus from your computer.
What People Feel
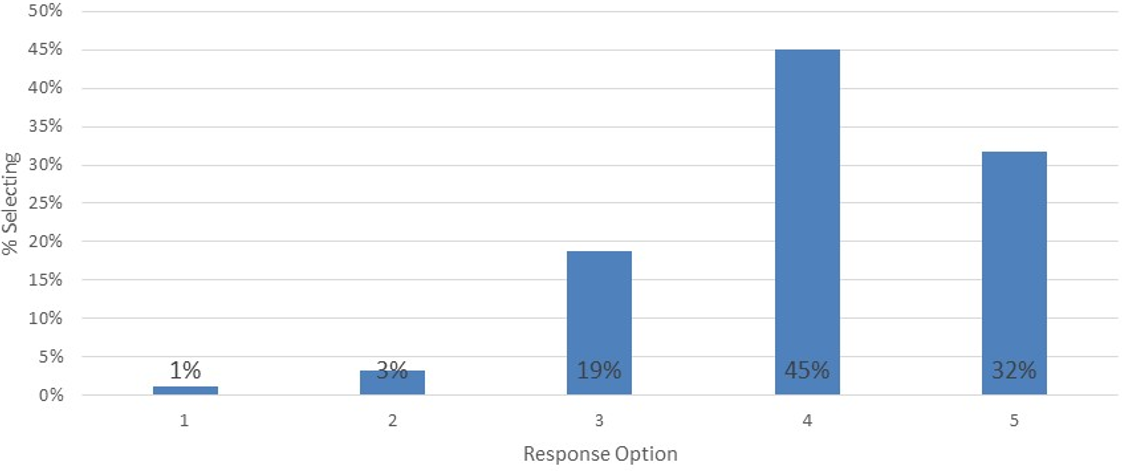
We also included one simple unipolar item to capture participants’ self-assessment of their level of tech savviness (Figure 1).

Study Description
In December 2015, we recruited participants from Amazon’s Mechanical Turk to answer a battery of the tech-savvy pilot items listed above and collected data across five separate studies. After removing poor-quality respondents (e.g. speeders), we had 271 usable cases. We had participants select the activities they felt confident doing without help (from the list above, e.g., install a printer, use Excel formulas). We also created a tech-savvy quiz using the seven tech concepts listed above (e.g., Blu-ray, VoIP). For example, here are the quiz questions for Ultrabook and 1080p:
What is an Ultrabook?
- Full HD, indicating the number of pixels a TV screen can display
- An optical disc storage medium designed to supersede the standard DVD format
- A small, light, inexpensive laptop
- A lightweight high-performance laptop
- Technology that lets you get phone service over the internet.
What is 1080p?
- A way to link devices such as printers and smartphones to your computer
- A TV system that has more than the usual number of lines per frame, so pictures show more detail
- Full HD, indicating the number of pixels a TV screen can display
- An optical disc storage medium designed to supersede the standard DVD format
- The standard unit of measurement for the digitized image resolution
Finally, we had participants answer the five-point tech-savvy self-assessment item shown in Figure 1: “On a scale of 1–5, rate how technically savvy you are.”.
Study Results
Quiz
Table 1 shows the quiz results. A large majority (≥ 85%) of participants selected the correct response for four of the seven questions. The 1080p item gave respondents the most difficulty.
| % Correct | |
|---|---|
| Blu-ray | 86% |
| VoIP | 85% |
| USB | 87% |
| Megapixel | 85% |
| HDTV | 71% |
| 1080p | 62% |
| Ultrabook | 76% |
Table 1: Percent selecting the correct responses from the tech-savvy quiz questions (n = 271).
Checklist of Activities
Table 2 shows the percentage of respondents selecting the activities they feel confident doing without help. Five of the thirteen activities were selected by almost all participants (> 90%). The three activities selected by the fewest respondents were related to troubleshooting networks and programming (HTML, Java).
| % Selecting | |
|---|---|
| NewPhone | 92% |
| NewSoftware | 91% |
| InstallPrinter | 91% |
| NewApp | 91% |
| Voicemail | 91% |
| Router | 79% |
| PPT | 79% |
| Remote | 77% |
| Virus | 73% |
| Excel | 60% |
| NetWorkProbs | 56% |
| HTML | 42% |
| Java | 15% |
Table 2: Percent selecting activities they feel confident doing without help (n = 271), sorted from most to least selected.
Tech-Savvy Self-Assessment
Figure 2 shows the frequency distribution for the tech-savvy self-assessment item. Most participants (77%) selected 4 or 5. Only three respondents selected 1 (and only 3% selected 2), which likely indicates the sort of respondent characteristics one can expect from an online panel like Mechanical Turk.
We then looked at how the ratings, quiz, and activities complemented each other.
Tech-Savvy Rating by Quiz Results
The correlation between ratings on the single tech-savvy item and quiz results was statistically significant but small in magnitude (r(269) = .14, p = .02). We conducted an ANOVA using the number of correctly answered quiz questions (0 to 7) as the dependent variable and tech-savvy rating (1 to 5) as the independent variable, for which there was a modest but statistically significant result (F(4, 266) = 2.12, p = .078).
As shown in Figure 3, respondents who self-selected as the most tech-savvy got almost all questions correct (5.9) compared to the least tech-savvy, who got 5 out of 7 correct. The number correct was slightly higher for 3s than 4s, making the relationship less clear, and with means ranging from 4.9 to 5.9. Quiz scores were not very discriminating as a function of self-assessed tech savviness.

Tech-Savvy Rating by Activities
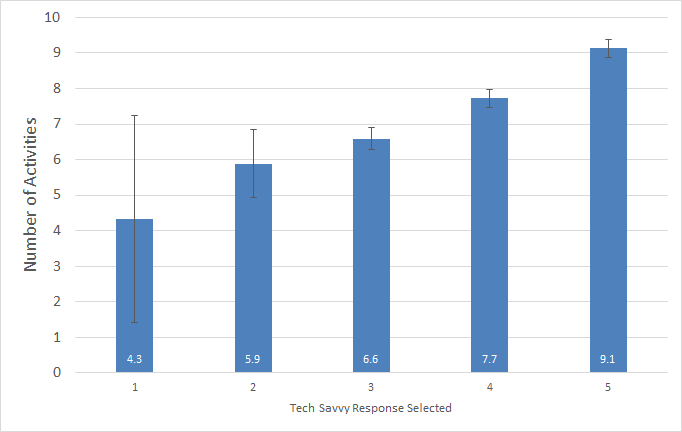
The correlation between ratings and activities was medium-large (r(269) = .45; p < .0001). An ANOVA using the number of activities selected (0 to 13) as the dependent variable and the tech-savvy self-assessment rating (1 to 5) as the independent variable indicated a strong and statistically significant result (F(4, 266) = 17.05, p <.0001). As shown in Figure 4, the number of activities increased for each level of self-assessed tech savviness. Respondents who assessed themselves as the most tech-savvy reported being confident with about twice as many activities (9.1) as the least tech-savvy (4.3).
Summary and Discussion
In UX research, tech savviness is rarely the focus of interest, but measuring it is important because differences in tech savviness likely affect experiences using technologies, attitudes toward technologies, and resulting behavioral intentions to use or recommend technologies. Our 2015 pilot study (n = 271) of three candidate tech savviness measures (quiz, activity checklist, self-assessment) found that
Quizzing seemed to be the least promising approach. Statistically, scores for the seven-item quiz were significantly correlated with the five self-assessment levels, but the correlation was relatively weak (r = .14). Quiz scores for the five self-assessment levels ranged from a mean of 4.9 to 5.9, so the quiz scores were not very discriminating as a function of self-assessed tech savviness. In addition to these statistical issues, quizzes are harder to create and maintain because you need good sets of distractors for each question, enough questions with varying difficulty to get a discriminating measure, and questions that ask about current technologies (e.g., Blu-ray and Ultrabook have become obscure terms, and 1080p is no longer the standard for high definition, having been replaced by 4K). Better-calibrated or additional items may show more promising results.
Self-assessment showed some promise. The self-assessment levels significantly correlated with quiz and activity scores (more so with activity scores). Because there was only one five-level self-assessment item in this study, the self-assessment measure was coarse and, for this source of respondents, had a ceiling effect, with 78% of respondents selecting 4 or 5 on the scale (only 4% selecting 1 or 2). Additional items may provide more encouraging results.
The activity checklist was the most promising approach. For any select-all-that-apply (SATA) checklist, knowing how accurate the scores are is difficult, but respondents find them easy to complete and strongly prefer them over forced-choice grids. In this case, the correlation between the activity checklist score (the number of selected activities) and the level of self-assessed tech savviness was relatively strong (r = .45), showing good convergent validity. The number of selected activities increased with each increasing level of self-assessed tech savviness, from 4.3 at the lowest level to 9.1 at the highest (a good range of discrimination). It’s hard to beat a single questionnaire item that discriminates levels of tech savviness AND tells you the activities people can do confidently.
Limitations: Respondents in this study appeared to have relatively high levels of tech savviness, which limits our ability to assess how well our tech-savvy assessment works with lower levels. Also, our validation of quizzes and checklists was limited to correlation with a fairly coarse measure of self-assessed tech savviness rather than a performance score such as a percentage of successful task completion.
Future research: These findings guided the next round of research, which we will discuss in a future article. For example, to improve the efficiency of measurement, we modified the quiz and activity checklist by removing items, and to increase the sensitivity of the self-assessment method, we added more items.