 Are you sure you did that right?
When we put the effort into making a purchase online, finding information or attempting tasks in software, we want to know we’re doing things right.
Having confidence in our actions and the outcomes is an important part of the user experience.
That’s why we ask users how confident they are that they completed a task in a usability test or a tree test. To measure confidence we use the following seven-point rating scale.

Even if users are completing tasks or finding items in a navigation structure correctly, it doesn’t mean they are 100% sure that what they did was correct.
Understanding how confident users are that they completed a task is one of many ways of diagnosing interaction problems and providing a benchmark for comparisons between tasks or versions. (Note: This measure of confidence is different than a confidence interval, which is a statistical procedure to put the most plausible range around a sample mean or proportion).
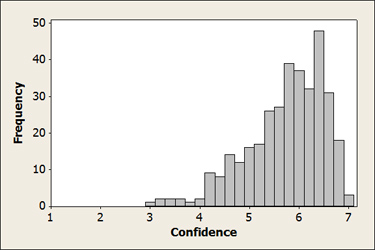
Like many UX measures, it can be helpful to have a comparison to provide more meaning to the data. We’ve collected confidence data for a few years now and have compiled data from 21 studies representing 347 tasks, each with between 10 and 320 users. The distribution of the confidence scores is shown below.

As can be seen in the distribution, there is a positive skew in the results. Most responses fall above the midpoint of 4. The mean level of confidence is actually a 5.7 and the median is a 5.8.
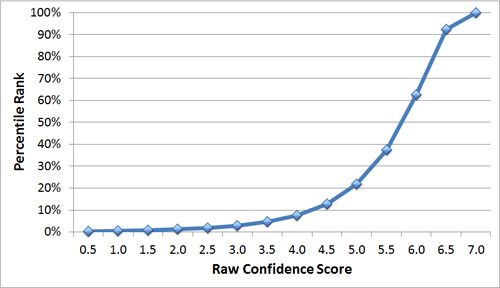
With this large sample of data, we can convert raw confidence scores into a percentile rank. Due to the positive skew, we first do a transformation of the data to make it more symmetrical, so we can use the properties of the normal curve. The graph below shows the conversion from raw confidence score to percentile rank.

For example, if a task has an average confidence score of about a 6, it falls at about the 60th percentile—meaning it scores higher than about 60% of the tasks in the dataset. A score of 5.75 is right at the 50th percentile (the average score).
A confidence score of a 5 (just a 1-point drop) puts the task rank at the 20th percentile—meaning users are less confident than 80% of all tasks. The difference between high and low confidence happens all within about a point and a half, ranging from 5 to 6.5 (where the slope of the line in the graph above is steepest).
Self Reported Confidence as a Measure of Task Completion
In measuring usability, it would be easy to just ask users if they completed a task. But, as is the problem with many self-reported measures, people aren’t exactly the best judges of their own behavior. Users tend to be overconfident in their ability to complete tasks. Men, in fact, tend to be even more over-confident than women. But how good or bad of a measure is self-reported task confidence regardless of gender?
To understand the relationship between task confidence and actual task completion, I looked at a subset of the data from five studies with a total of 5,246 task observations. For example, in one study with 172 users and 9 tasks, there were 1,548 total observations where we can see what the confidence rating was when users passed or failed to complete a task. While asking users if they completed a task using a dichotomous response (yes/ no) isn’t the same as our seven point rating of confidence, using the highest level of confidence is a conservative proxy.
Technical Note: Not all observations in this dataset are independent, as the same users are rating multiple tasks within each study, but it still provides a reasonable picture from which to draw conclusions about the relationships between actual task completion and confidence.
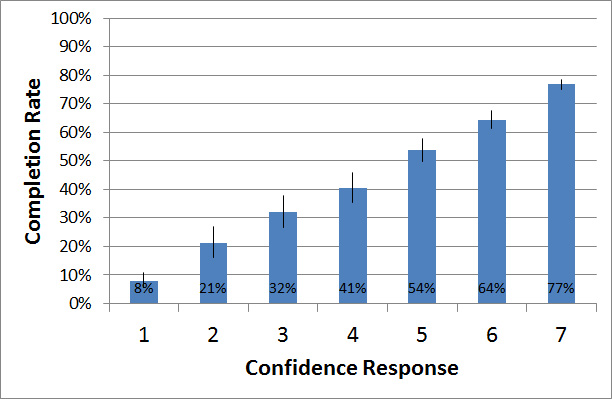
The graph below shows the average completion rate for each confidence response option.

For example, for participants who gave a response of a 1 (the least confident response) after a task, only 8% actually completed the task successfully. Conversely, 77% who rated the task a 7 (the most confident response) completed the task successfully. Each confidence response level has an average completion rate that is statistically higher than the previous level.
What’s interesting is that, while the percentage of users who report being extremely confident they completed the task successfully is high (77%), it means that on average, 23% of participants failed the task but were extremely confident they didn’t! If we lower the bar slightly to include 6’s and 7’s then some 36% of users are failing tasks, yet reporting being very confident they were successful. This data also suggests that confidence scores of less than a five mean it’s likely less than half the users would complete the task.
Disasters
We call high confidence and task failure a disaster, and it is also another metric for diagnosing user-experience problems (inspired by Gerry McGovern). You really don’t want users being extremely confident they completed a task when they get it incorrect. For example, if users are asked to find the value of a car on an automotive website and get the wrong value, but are extremely confident it’s the right value, this is a disaster. It’s a disaster because, in this case, users are confidently equipped with the wrong information: information they may take to a car dealer when looking to purchase or sell a vehicle.
This exercise shows that self-reported confidence does track actual task completion rates, but rather coarsely. If one interface had an actual task-completion rate of 85% compared to another with 65%, this difference would likely not show up if relying on confidence as a self-reported measure of task completion.
This doesn’t mean you can’t use confidence as a measure of success; just be aware of the reduced ability to detect differences in actual task completion. Measuring confidence is a valuable metric for diagnosing interaction problems, both by itself and when combined with task completion to generate disaster rates. Converting the raw score to a percentile rank using the graph above will also help communicate confidence rating. Where possible, it’s best to have an objective measure of task completion along with a self-reported measure like confidence.


