 Customer satisfaction is a staple of company measurement.
It’s been used for decades to understand how customers feel about a product or experience.
Poor satisfaction measures are an indication of unhappy customers, and unhappy customers generally won’t purchase again, leading to poor revenue growth.
But is satisfaction the wrong measure for most companies?
That’s certainly the claim Fred Reichheld has made and advocated the Net Promoter Score as a better measure of company growth.
In his book, The Loyalty Effect, Reichheld makes a compelling claim against satisfaction as an effective measure of growth. He reported that 90% of car customers reported being satisfied or very satisfied when responding to a customer satisfaction survey, yet less than 40% actually repurchased the same brand of car (p. 236).
He strengthened that claim in his 2003 HBR article:
“Our research indicates that satisfaction lacks a consistently demonstrable connection to actual customer behavior and growth.”
In particular, he calls out the American Consumer Satisfaction Index (ASCI) as being a poor predictor of growth:
“…it is difficult to discern a strong correlation between high customer satisfaction scores and outstanding sales growth.”
Some Evidence NPS Predicts Future Growth
In an earlier article, I examined the claim that the Net Promoter Score was a predictor of future company growth. In general, l was surprised to find little evidence to support this central claim. Most evidence that shows a relationship between the NPS and revenue used historical, not future, growth, including Reichheld’s own work.
To examine the relationship myself, I used the high-profile U.S. airline industry and after I removed an outlier, I was able to show a strong positive relationship between the NPS and future growth within the airline industry. But would satisfaction have done just as good—or even better—a job predicting growth?
NPS vs Satisfaction
Studies have linked customer satisfaction to future business performance; for example, Anderson, Fornell, and Mazvancheryl (2004). But I looked for studies that compared satisfaction and NPS to predict (or correlate with) company metrics. In the studies I found, satisfaction was reported as better or indistinguishable from the Net Promoter Score. For example:
Keiningham et al. 2007 re-examined Reichheld’s original data using ASCI customer satisfaction and found in two of the three cases, the R-square of the ACSI–growth relationship was higher than that for the Net Promoter–growth relationship.
Pingitore et al. 2007 found the Net Promoter Score was not the best predictor of change in historical revenue. For example, for the rental car industry, it was Net Satisfied; within the airline industry, it was a multi-item satisfaction index.
Dutch researchers de Haan et al. examined 93 Dutch firms in 2015 to assess the predictive capability of the NPS and satisfaction on customer retention rates in the Netherlands and found that customer satisfaction was actually a nominally better predictor than NPS (r=.18 vs. r=.17 respectively).
In 2006, Morgan and Rego conducted a large study to examine 561 U.S. companies in the ACSI (from 1994 to 2000). They looked at six measures of business success: sales growth, margin, market share, net cash flow, shareholder returns, and Tobin Q.
They found average satisfaction scores had the greatest value in predicting future business performance. They found a measure of loyalty (later equated with the Net Promoter Score) did not statistically correlate with business metrics
NPS vs. Satisfaction in the U.S. Airline Industry
To see if I could find evidence that the NPS is a better measure of growth, I re-examined the U.S. airline revenue data I used where I found NPS was a good predictor.
I computed the revenue growth in the U.S. airline industry and compared that against the Satmetrix 2013 NPS data (as found in its 2014 report [pdf]).
For satisfaction data, I used two data sources. The first was provided by J.D. Power, which uses a 1000 point scale with higher numbers indicating higher satisfaction. The second was Consumer Reports, which uses a 0 to 100 satisfaction scale.
As I did with the other analysis, I removed American Airlines due to its substantial acquisition of US Air during the analysis period. The raw data is shown in Table 1. Not all data points are available from each source. For example, Consumer Reports included data from Hawaiian, Frontier, and Spirit and J.D. Power didn’t have data on Virgin America. To try and make the comparison even, I only included the airlines that all three sources had data on. This left five airlines: Delta, United, Southwest, JetBlue, and Alaska.
| Airline | 2013 NPS | 2013 J.D. Power | 2013 CS Reports | 2014-2016 Growth Rate |
|---|---|---|---|---|
| American | 10 | 660 | 66 | |
| Continental | 16 | |||
| Delta | 19 | 662 | 71 | -1.0% |
| United | 2 | 641 | 63 | -3.0% |
| Southwest | 65 | 770 | 85 | 5.0% |
| JetBlue | 57 | 787 | 85 | 7.0% |
| AirTran | 21 | |||
| Frontier | 78 | |||
| Virgin America | 52 | 89 | ||
| Alaska | 51 | 717 | 81 | 4.0% |
| Hawaiian | 82 | |||
| Spirit | 50 |
Table 1: Raw data used to compute the relationship between customer attitudes and future revenue growth.
Both the J.D. Power and Consumer Report satisfaction data correlated very highly with the NPS data (r =.96 and r=.97 respectively). I found all three measures correlated highly with future revenue growth. In fact, the differences were statistically indistinguishable and virtually identical.
Table 2 shows the adjusted R-squares for the three measures of consumer attitude. NPS had actually the lowest explanatory power at R-sq = .897, with J.D. Power nominally higher at .915 and Consumer Reports was the highest at .942. Figure 1 shows the strong linear relationship using any of the three attitudinal measures.
| Measure | Adj. R-Sq |
|---|---|
| Net Promoter Score | .897 |
| J.D. Power Satisfaction | .915 |
| Consumer Reports Satisfaction | .942 |
Table 2: Adjusted R-Square values for three attitudinal measures and future revenue growth in the U.S. airline industry.
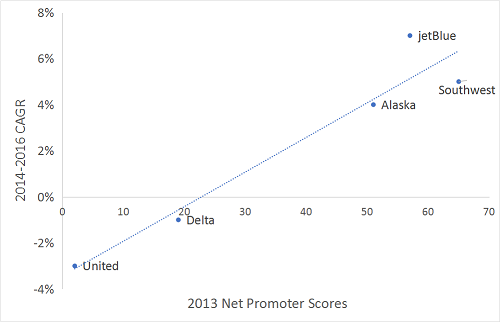
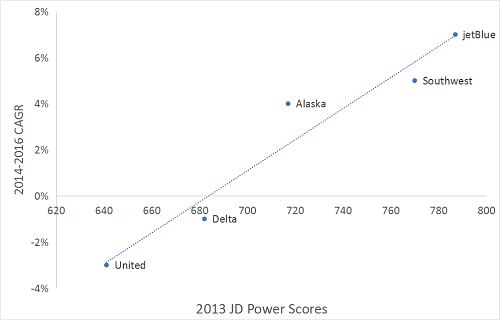
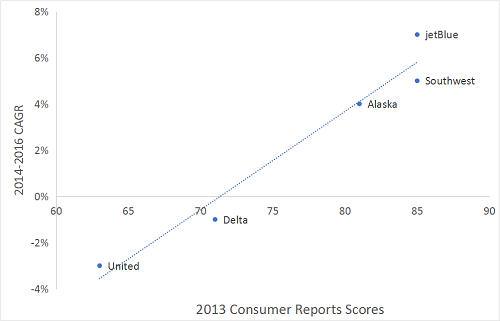
Figure 1: The relationship between three customer attitude measures from 2013 (NPS, J.D. Power, and Consumer Reports Sat) and revenue growth from 2014-2016 in the U.S. airline industry (American Airlines excluded).
Summary & Takeaways
A review of published studies comparing NPS and satisfaction and examining the U.S. airline industry growth rates found:
- The NPS performed the same or worse than satisfaction in predicting future business metrics.
- While I was able to show the NPS could predict future growth rates in the airline industry, two other measures of satisfaction actually did a slightly better job.
- Future research can examine more industries using satisfaction data, NPS, and future revenue to understand any difference.
- The NPS may be a better measure than customer satisfaction for other reasons (such as simplicity, executive understanding or availability of external benchmarks). This analysis found little evidence to suggest it’s universally (or ever) better than customer satisfaction measures for predicting revenue growth.
