 It’s the only number a company needs to grow.
Or at least that’s what was proclaimed in the title of the now famous HBR article that helped popularize the Net Promoter Score (NPS). Lately it’s been taking on more criticism.
The NPS is compelling to executives because of its simplicity and for what it purports to do: be the one number a company should track for revenue growth. For example:
- Net Promoter leaders are said to “outgrow their competitors [pdf] in most industries by an average of 2.5 times.”
- “a 12-point increase in Net Promoter scores leads to a doubling of a company’s growth rate on average.”
- “no airline has found a way to increase growth without improving its ratio of promoters to detractors.”
It’s hard to get simpler than the NPS. It’s only a single item, compared to multiple items in most customer satisfaction questionnaires. But while simplicity is good, it’s not the only thing. A good measure needs to be valid and reliable. Validity in this sense is best gauged by seeing how well the NPS lives up to its claim: to predict future growth.
NPS Validation
To establish the validity and make the claim that NPS predicts growth, Fred Reichheld, its creator, reported that the NPS was the best or second-best predictor of growth in 11 of 14 industries (p. 28). The data he provided in the appendix of his 2006 book, The Ultimate Question, to support the relationship, he shows data from 35 companies in six industries (computers, life insurance, Korean auto insurance, US airlines, Internet Service Providers, and UK supermarkets). He used business growth metrics (e.g. computer shipment growth, revenue growth) from six industries, including US airlines (see Figure 1 below).
Associating with Historical Revenue
In predicting revenue though, Reichheld used historical, not future growth. He showed the three-year average growth rates (1999–2002) correlated with the two-year average Net Promoter Scores (2001–2002). You can see an example of this in Figure 1 for US airlines.
In other words, the NPS correlated with past growth rates (as opposed to future growth rates). This point has been made by other authors; for example, Grisaffe (2007, p. 46 [pdf]) noted “something that happened in the future is being used as a cause of something that happened in the past.”
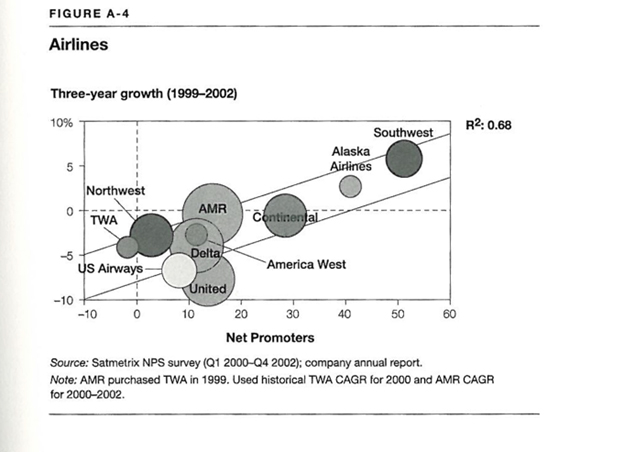
Figure 1: Excerpt from The Ultimate Question showing NPS survey data from 2000-2002 to predict growth rates from 1999-2002 (historical growth).
Surprisingly, this same approach was taken by researchers at the London School of Economics. Marsden et al. (2005) [pdf] who linked Net Promoter data collected in 2005 with sales growth data from 2003 and 2004 and found a more modest positive correlation (r = .48).
Pingitore et al. (2007) examined J.D. Power and Associates’ syndicated data in four industries (auto insurance, full-service investment, airline, and rental car) from data collected in 2005-2006. The total sample size included 26,944 consumers over a total of 64 brands. These were correlated with industry specific metrics (retention rates, revenue change, and wallet share). They reported strong correlations between the NPS and several business metrics. However, the periods were also historical. For example, the change in revenue was for the years 2002-2004—two to three years in the past.
Keiningham et al. (2007) [pdf] examined 21 Norwegian firms and used the same methodology as Reichheld and found the NPS didn’t statistically correlate with historical revenue growth (nor did any of their other attitudinal measures). They cautioned the inherent difficulty of predicting firm revenue growth within an industry on the basis of a single attitude-based metric and small sample sizes.
Association with Future Metrics
In 2006, Morgan and Rego conducted a large study to examine 561 US companies in the American Customer Satisfaction Index (from 1994 to 2000). They looked at six measures of business success: sales growth, margin, market share, net cash flow, shareholder returns, and Tobin’s Q.
They found the NPS did not statistically correlate with any future business measures. However, the authors did NOT use the 11-point Reichheld NPS and instead used customers that reported discussing their consumption experiences minus the number that reported formally or informally complaining. So while this is a form of word-of-mouth, it’s not the NPS. In a later rejoinder, Morgan and Rego (2008) showed a very strong correlation between the Reichheld NPS and their measure of loyalty (r = .973).
van Doorn et al. (2013) examined the relationship between several attitudinal measures collected in 2008, including the NPS, to predict current and future business metrics: sales revenue growth, gross margin, and net operating cash flow from the years 2008, 2009, and 2010. Similar to Reichheld, they found the 2008 NPS correlated with 2008 sales growth (r=.46) and sales margins (r=.22)—both were historical/concurrent measures though. They did not find the NPS, or any other attitudinal measure, correlated with any of their future growth metrics.
Dutch researchers de Haan et al. examined 93 Dutch firms in 2015 to assess the predictive ability of the NPS and satisfaction on customer retention rates in the Netherlands for mostly retail and service firms. They conducted an online survey of 6,649 customers from the Dutch consumer market. Two years later, a follow-up survey asked participants whether they were still customers. Data came from 1,308 participants (15.4% response rate) who answered both surveys.
They did find that the NPS was a statistically significant predictor of FUTURE stated customer retention. The correlation between likelihood to recommend and retention was, however, a modest (r=.17). In other words, the NPS explain around 3% of two year customer retention rates. This relationship was found at the customer and company levels, but not at the industry level. The authors concluded there was no single best metric to predict customer retention across industries.
While it seems the claims of NPS as being a predictor of growth are overstated, it might also be the case for other attitudinal measures. Keiningham et al. (2014) reported that on average, satisfaction explains only 1% of the variation in a company’s market return. The authors suggest that the relative standing of metrics like satisfaction and NPS are more predictive than absolute numbers. A future article will explore other methods for associating any attitudinal measures to future business metrics.
NPS & Future Company Growth
To see if I could find a relationship between future revenue growth and the NPS, I examined data from the US airline industry, which has generally accessible revenue and even NPS data. I computed the revenue growth in the US airline industry from 2014 through 2016 and compared that against NPS data reported by Satmetrix’s 2013 NPS data (as found in its 2014 report [pdf]). While the 2013 data wasn’t listed, I extracted 2013 data by interpolating it from the graph in the report.
The relationship between future growth (2014-2016 CAGR) and 2013 Net Promoter Scores is shown in Figure 2. The relationship is not statistically significant nor shows a positive linear pattern.
However, a closer look at the companies and revenue history shows the airline industry is still in consolidation (similar to Figure 1 from a decade earlier). During this period, American Airlines acquired US Air (an airline with 58% of AA’s 2014 revenue). This significantly increased AA’s growth during the 2014-2016 period and is likely an anomaly affecting the correlation.
Prior to the analysis period, Southwest acquired AirTran (22% of its 2011 revenue) so AirTran revenue is not available between 2014-2016 even though Satmetrix reported Net Promoter Scores. This acquisition growth seems to have been baked-in prior to the 2014-2016 period and doesn’t appear to have as much of an impact on growth during the analysis period.
Figure 2: 2014-2016 revenue growth (CAGR) by airline and 2013 Net Promoter Scores. Circle size shows the proportional 2016 revenue by airline.
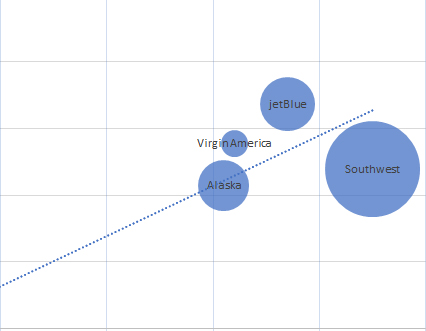
Figure 3 shows the relationship between future growth—compound annual growth rates (2014-2016 CAGR) and 2013 Net Promoter Scores after I removed American Airlines. Now there is a very strong positive and statistically significant relationship between future growth in the US airline industry and NPS—at least after removing the largest airline and using this one three-year period. NPS now explains 92% of the variation in future revenue for these US airlines. It does provide some evidence to supports Reichheld’s claim about the airline industry as well as validate some complaints from frequent travelers of United Airlines.
Figure 3: 2014-2016 revenue growth (CAGR) by airline and 2013 Net Promoter Scores excluding American Airlines that acquired US Air during the revenue period. Circle size shows the proportional 2016 revenue by airline.
Summary & Takeaways
1. There is some evidence NPS predicts future company revenue growth. I was able to find a relationship between 2013 NPS and 2014-2016 revenue growth in the US airline industry (after removing one large outlier). There is only one published study I found that established a statistically significant relationship between the NPS and future business metrics (two year customer retention). In the remaining published studies, including Reichheld’s, the NPS was validated against historical or very near-term revenue and metrics.
2. NPS correlates with historical and concurrent measures of business outcomes. Several studies, including Reichheld’s, have established a reasonably strong correlation with business metrics, such as revenue growth. This does provide strong evidence of concurrent validity, although it doesn’t support making claims about future company growth.
3. Be cautious about making causal statements about NPS and future or current revenue. NPS seems to be a reasonable proxy for historical or current revenue in some industries and potentially for future revenue and likely self-reported customer retention. Additional research in more industries is needed. It’s interesting that Satmetrix and Fred Reichheld haven’t published more to validate the NPS using historical NPS and future business growth metrics.
4. The causal relationship between NPS and growth is unclear. Net Promoter Scores could be a consequence and not a cause of company growth or related to growth through another variable entirely (e.g. customer satisfaction). That is, more successful companies tend to have customers that are willing to recommend and hence generate higher Net Promoter Scores. Future research is needed to establish a causal link and such research needs to better manage the temporal precedence to establish causation: higher Net Promoter Scores need to precede higher revenue.


