 Five-star reviews. Whether you’re rating a product on Amazon, a dining experience on Yelp, or a mobile app in the App or Play Store, you can see that the five-star rating system is quite ubiquitous. Does the familiarity of stars offer a better rating system than traditional numbered scales?
We recently reported a comparison between standard five-point linear numeric scales with 0–100-point slider scales made with UMUX-Lite data. Despite major differences in the scale formats, after converting the numeric scale data to 0–100-point scales, the means differed by just 0.6 points.
We occasionally find meaningful differences in measurement quality due to differences in item formats (e.g., evidence that having just three response options in single rating scales is markedly insufficient for accurately capturing attitudes and sentiments). However, often we find no significant differences in the context of UX research. The thing is, though—you just don’t know until you collect some data.
While we collected data comparing numeric and slider scales, we also collected an independent set of data for the comparison of five-point numeric and five-star graphic scales similar to Amazon’s rating scale: 335 participants sampled from a US panel agency rated streaming entertainment services such as Netflix, HBO Now, Amazon Prime Video, Hulu, and Disney+ in May–June 2020 (for more information see our article and downloadable report). Due to both formats having five response options, we expected the results to be at least as close as those we found comparing numeric and slider scales, but that isn’t quite what happened.
What Are Star Scales?
Figures 1 and 2 show examples of numeric- and star-scale versions of the UMUX-Lite (both types of scales have five response options).
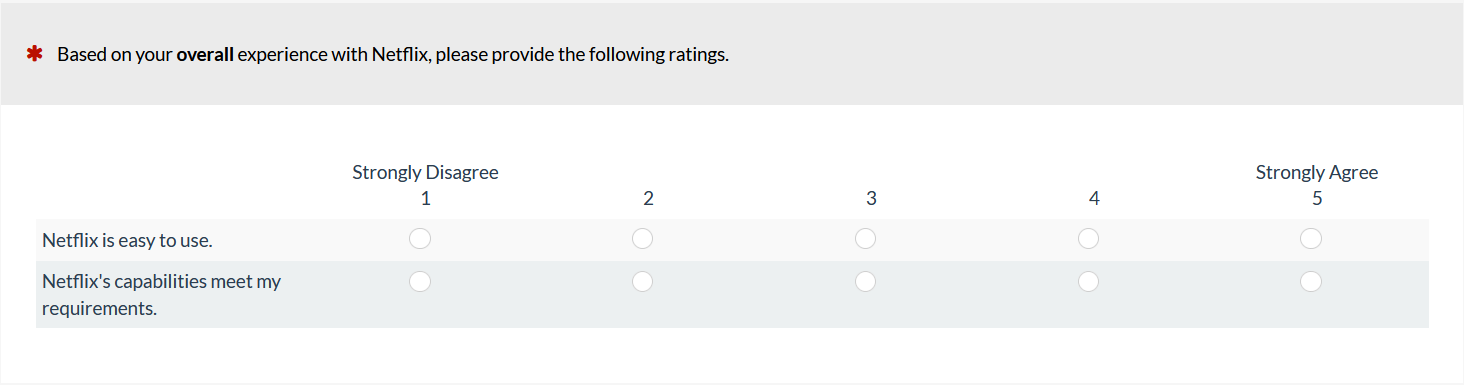
Figure 1: Example of a linear-numeric version of the UMUX-Lite (created with MUIQ).

Figure 2: Example of a star-scale version of the UMUX-Lite (created with MUIQ).
Star scales can have endpoints labeled or bare and, if the context is clear (as it is on Amazon and movie rating sites), often appear without any accompanying statement (e.g., “Please rate your satisfaction with this product”). People generally understand that a rating with more stars reflects a more positive sentiment or attitude.
Other than some substantial literature on using star ratings in recommender systems, there is little available about their measurement properties—and, as far as we know, no published comparison with concurrently collected linear numeric data (Figure 1).
Stars vs. Numbers Experiment
Continuing our interest in how variations in item format affect measurement of the user experience, we set up a Greco-Latin experimental design to support a within-subjects comparison of UMUX-Lite ratings on a variety of streaming entertainment services. (This is the same experimental design we used with the slider comparison study.) With this design, there were three independent variables:
- Item Format (linear numeric, stars—see Figures 1 and 2)
- Rating Context (rating of most recent experience with the service; rating of the overall experience with the service)
- Order of Presentation (numeric/recent then stars/overall; numeric/overall then stars/recent; stars/recent then numeric/overall; stars/overall then numeric/recent)
Participants were randomly assigned to one of the four orders formed by the crossing of Item Format, Rating Context, and Order of Presentation. Across the experiment, this controls for the “nuisance” variables of Rating Context and Order of Presentation. (In addition to experiments we conduct for ourselves, we use this study design for client projects when we need to efficiently control nuisance variables and want the enhanced precision of a within-subjects design.)
We found a small but statistically significant difference of 1.3 points in mean UMUX-Lite scores between the overall ratings of stars and numbers (F(1, 151) = 4.7, p = .03). We also found a small but statistically significant effect of presentation order (F(1, 151) = 5.1, p = .025).
As shown in Figure 3, the means for the numeric scales were very close (a difference of about 1.5 points) despite changing presentation order. For the star scales, however, there was a greater difference (about 4.5 points); the larger mean for star scales happened when stars were presented after numeric scales. All other main effects and interactions were not statistically significant (all p > .20 with 151 error df).
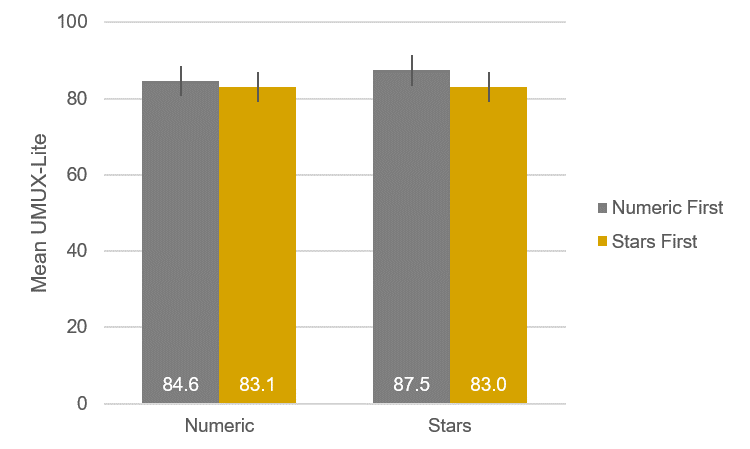
Figure 3: Item format (numeric vs. stars) by presentation order (numeric first or stars first) interaction.
It’s important to note a couple of things about this finding. First, statistical significance doesn’t necessarily indicate practical significance. Statistical significance is a signpost with flashing neon lights that say, “You should look at this.” So, when we look at this interaction, we see that all the means are quite high relative to a historical UMUX-Lite average of 68 (based on how closely it corresponds with concurrently collected SUS scores—see Lah et al., 2020, Table 9). Also, numeric scales seem to be more stable—less affected by presentation order—than star scales. On the other hand, it seems unlikely that numeric and star scales would be mixed outside this type of experiment, so this potential issue with star scales is somewhat artificial.
Moving away from the interaction, Figure 4 shows the main effect of item format without considering any of the nuisance variables. The corresponding t-test was just on the edge of traditional statistical significance (t(154) = 1.958, p = .052). A 95% confidence interval around the observed difference of 1.3 ranged from -2.6 to 0.1, so a difference of 0 is plausible, but any absolute difference exceeding 2.6 points is not plausible. There is no external benchmark for determining which of the means is “correct,” but the confidence interval shows that all plausible differences are relatively small given the full range of the UMUX-Lite (0 to 100 points).

Figure 4: Overall difference between UMUX-Lite means for numeric and star scales.
Summary and Takeaways
In this experiment, we found a small difference between mean UMUX-Lite ratings collected with standard linear numeric scales and star scales.
The overall observed difference (1.3 points) was larger than the difference we found in a similar experiment comparing numeric with slider scales (0.2 points) but was still small relative to the full range of the UMUX-Lite (0 to 100 points).
A 95% confidence interval around the observed difference ranged from -2.6 to 0.1 points, so a true difference of 0 is plausible, but any absolute difference exceeding 2.6 is not.
The significant interaction between item format and presentation order indicated a potential issue with star scales. Star means were higher when stars were presented after numbers but not when they were presented before numbers.
Taken together, these results support the use of either format in UX research, but practitioners should avoid mixing them in the same study. Because there doesn’t appear to be any particular advantage in using star scales, UX researchers should feel comfortable with standard linear numeric rating scales.
[Note: Slightly revised on 9/3/2020]