The results of the 2016 UXPA salary survey are in.
This is the 5th UXPA survey we’ve crunched the numbers for and it showed similar patterns as 2014.
The Results
- The data was collected from September-December 2016 using a non-probability sample. Initial respondents were recruited through postings on professional networks and websites, such as UXPA and LinkedIn. Additional respondents were recruited using snowball sampling. Please keep this sampling services in mind as it impacts the generalizability of the findings and even comparability to the 2014 data.
- The survey is based on 1,228 responses from 37 countries, with 75% of the responses coming from the US. Other significant numbers come from France (5%), UK (4%), Canada (3%), and Germany (2%).
- The median 2016 salary is $98k. This is an inflation adjusted increase (2016 constant dollars) of 5% over the 2014 results. Since 2005, the inflation adjusted median salary is up by 6%.
- The $98k average is based on many variables, so you can’t look at that alone to gauge how well your own salary stacks up.
What Factors Affect Salaries?
You can more accurately determine the worth of your skills and personal characteristics if you take into account the variables that most affect salaries. As we did in 2014, we conducted a multiple-regression analysis (on the log-transformed salaries) to see which variables statistically predict what people earn (Figure 1).
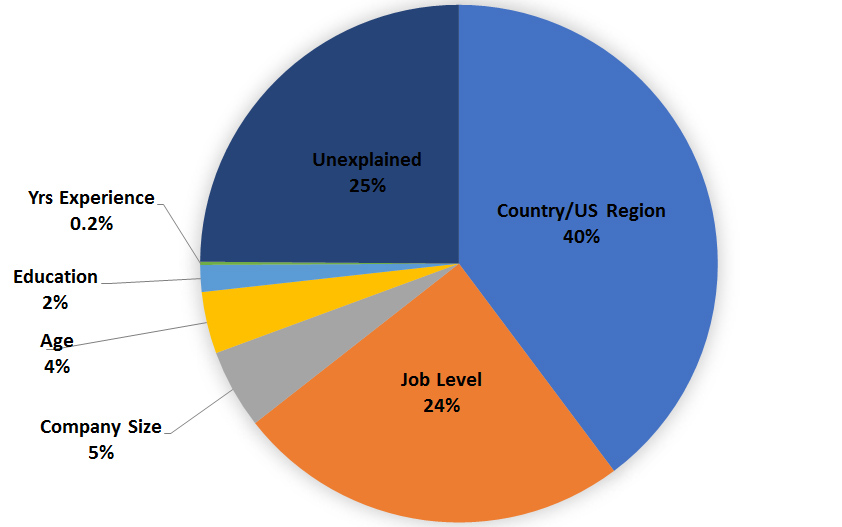
Figure 1: The above key drivers explain 75% of the variation in salaries.
The regression equation predicted 75% of the salary variations. (The dark blue section of the chart represents the unmeasured or unknown variables.) For the behavioral sciences, explaining 75% of variation is excellent. Individual factors—skills, personalities, negotiation, companies, etc.—affect your salary; keep that in mind as you review the numbers and use the calculator below.
The most influential factors for salaries in the UX field are (in order of importance):
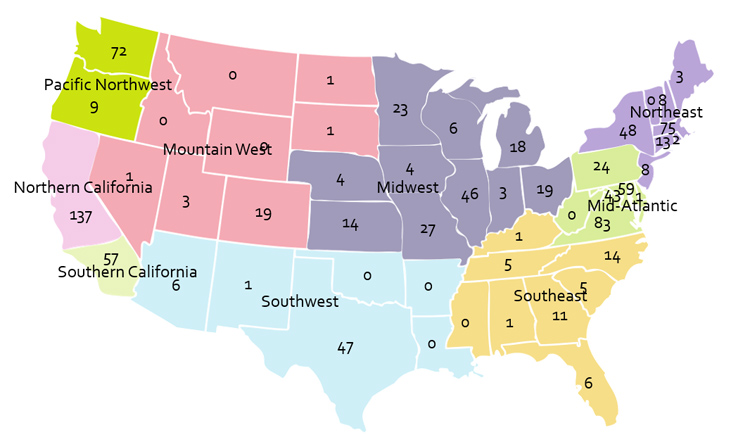
- Where you live: The country (and region for the US) has the biggest impact on what you get paid. The median salary in the US is $110k, compared to $104k in Switzerland, $67k in the UK, $65k in Canada, $61k in Germany, $44k in France, and $33k in India. All other countries had fewer than 10 respondents.In the US, the highest salaries are in Northern California (Silicon Valley), followed by Southern California and the Northeast. Not surprisingly, these places also cost the most to live. The map below shows the number of usable salaries we analyzed for each state and for what we called the region.
- Job level: The next biggest driver of salaries is job level, accounting for 25% of the variation in salaries (very similar to the 24% from 2014). Managers with direct reports (mid-level supervisor, senior supervisor, executive, owner/director) make more than the average salary. Entry-level positions, not surprisingly, pay less than average.
- Company size: The bigger the company, the bigger the paycheck. It’s hard for small companies to compete with the big payroll of larger companies. In the US, salaries at companies with fewer than 10 employees are paid around $20k less than the equivalent positions at larger companies (above 1,000 employees).
- Education: Your degree matters (somewhat). Around 10% of respondents reported having a Ph.D. (similar to years past). Having a Ph.D. adds around $10k to the average salary. About half of respondents hold a masters degree and it adds about $4k.
- Gender and age: Somewhat similar to 2014 and 2011, there is an interaction between gender and years of experience. Women are paid slightly more than men when they have fewer years of experience (15 years or less). For more than 15 years of experience, men tend to have a higher salary. This interaction effect however was not significant in the model–meaning other variables explain differences in gender and experience. The age cohorts that had a statistical impact on salaries were Generation Xers between the ages of 36-45, which tended to have a slightly positive effect on predicted salaries (around $2k) and those older than 65 had a sizable $20k impact on salaries (although there were very few in the sample).
- Experience: The more experience you have, up to about 21 years, the more you get paid. On average, each year of experience adds about $1900 to the base salary.
Salary Calculator
To estimate your theoretical salary based on the 2016 data, enter your information in the calculator below. (Only the variables that were found to statistically impact salary were included. Taken together, these explain around 76% of the variation in salaries.) This year we’ve included a 95% confidence interval around the prediction to better illustrate the expected variability around each salary estimate.
Examples:
- The estimated salary for a 31-year-old female, mid-level non-supervisor, with five years of experience at a mid-sized company (1,500 employees), in the Southeast US, and holding a Bachelor’s degree is $81,916, with a 95% confidence interval of $68,579 and $97,764. There was one person in the sample who met these criteria in the survey with a salary of $81,499—showing good agreement between the predicted and actual values.
- A 42-year-old male, mid-level non-supervisor, with a PhD and ten years of experience, working in Chicago, at a large company (10,000+) would be expected to earn $108,745 with a 95% confidence interval of $79,126 and $149,327. There was one person who met these criteria with a salary of $140,499. The predicted value was lower than expected but it still fell within the 95% confidence interval.
- A 45-year-old female, mid-level non-supervisor with ten years of experience, at a mid-sized company (2,000 employees), in London, with a bachelor’s degree has a predicted salary of $63,243 with a 95% confidence interval of $49,520 to $80,701. One person in the survey met these criteria with an actual salary of $65,499 (also close agreement).
Conclusion
Like many activities in the behavioral sciences, predicting salaries is an inexact science. Other variables and individual differences substantially affect salaries. The predicted salaries are based on what UX professionals reported making, so expect individual results to vary. The predicted median salary will be less accurate than using the 95% confidence interval around the predicted salary. Please contact us if you find a large discrepancy between your salary and the predicted salary.
Note:
- Salaries generated by this calculator are estimates around the median; you can expect variability above and below each estimate.
- The calculator estimates values even for combinations unlikely to exist (e.g., executives with two years of experience) so proceed with caution when computing “what-if” scenarios.
")
")
