featured image with 3d graphs

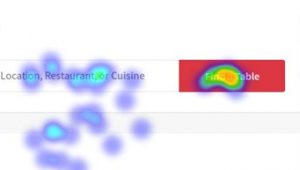
Are 3D Graphs Always Worse Than 2D Graphs?

There are many ways to visually display quantitative information. Excel offers dozens of chart types and color combinations, including those in 3D. But is it good practice to use 3D graphs? Edward Tufte is a famous and vocal critic of using 3D elements or any other decoration in graphs. In his book, Visual Display of

Read More »

4 Ways to Visualize Website Behavior

In the era of big data, the issue is less about not having enough data, but about deriving enough meaning from the data you have. Techniques and tools that help quickly identify patterns and insights to help improve user experiences are becoming increasingly important. For years we have helped companies benchmark the overall website user

Read More »

5 Techniques to Identify Clusters In Your Data

Understanding who your users are and what they think about an experience is an essential step for measuring and improving the user experience. Part of understanding your users is understanding how they are similar and different with respect to demographics, psychographics, and behaviors. These groupings are often called clusters or segments to refer to the

Read More »

10 Best Practices for Graphing & Displaying Data

Visualizing data can make digesting numbers easier and ideally lead to more efficient and accurate decisions. Graphs and visualizations aren’t without their risks, though. The choice of scales, graph types, and styles can all have an effect, for better or worse, on how your audience interprets the findings. Here are 10 best practices (and what

Read More »

Should All Graphs Start at 0?

People are wary of statistics. And if people think you can show anything you want with statistics, then this cynicism certainly applies to statistics graphs, too. For example, a few years ago the following graphic made its way around the Internet as an example of graphic abuse. Readers balked at what they saw as a

Read More »

How to Summarize & Display Survey Data

Surveys are one of the most cost effective ways of collecting data from current or prospective users. Gathering meaningful insights starts with summarizing raw responses. How to summarize and interpret those responses aren’t always immediately obvious. There are many approaches to summarizing and visually displaying quantitative data and it seems people always have a strong

Read More »
0
    0
    Your Cart
    Your cart is emptyReturn to Shop
    Scroll to Top