 Tree-testing is a lesser known UX method but can substantially help with improving problems in navigation.
There are several software packages to allow you to conduct card sorting quickly and remotely, including solutions from MeasuringU and OptimalWorkshop.
Like the other popular method for testing IA, Card Sorting, we’ll cover tree-testing at the Denver UX boot camp. Here are several questions to get you thinking about using the method that I covered during a recent webinar.
When would you use a tree test?
Tree testing is sometimes referred to as reverse card sorting since you are finding items instead of placing them into a navigation structure (often called taxonomy). A tree test is like a usability test on the skeleton of your navigation with the design “skin” removed. It allows you to isolate problems in findability in your taxonomy, groups or labels that are not attributable to issues with design distractions, or helpers.
Tree tests also remove search from the equation as a substantial portion of users will use search while looking for information on a website. While a great search engine and search results page are essential for helping findability, so is navigation. You’ll want to isolate the causes of navigation problems and improve them so that when users browse, they find what they’re looking for.
Tree tests are ideally run to:
- Set a baseline “findability” measure before changing the navigation. This will reveal what items, groups or labels could use improvement (and possibly a new card sort).
- Validate a change: Once you’ve made a change, or if you are considering a change in your IA, run the tree test again with the same (or largely the same) items you used in the baseline study. This helps tell you quantitatively if you’ve improved findability, kept it the same, or just introduced new problems.
Finally, we have found that tree testing, while similar to card sorting, does generate different findings. For example, we found that difficulty sorting an item only explained 16% of difficulty finding the item–an overlap but not redundancy.
How do you select which items to test in a tree test?
If you have a manageable navigation with a few dozen to a hundred items, you can include all of them in the study. For large websites with thousands of items, this can get unwieldy fast. You may find that paring it down to a few hundred items is sufficient if you eliminate some less used paths for the testing.
When it comes to selecting items for testing in the structure, we like to work with items that either cross departments, come from a top-task study, or are items that had problems in an open card sort.
How many participants do you suggest for a tree test?
The sample size question initially comes down to the outcome metric. Because a tree test is basically a mini-usability test, we can use the same metrics in a usability test along with the same procedure to identify sample sizes. In general, the key metric will be whether the user successfully located an item, which is a binary measure like task completion (“found/didn’t find” coded as 1 and 0 respectively).
The table below shows the sample size you will need to achieve 95% confidence around the findability rates. For example, at a sample size of 93, if 50% of the users locate an item, you’ll be 95% confident that between 40% and 60% of all users would find the item given the same tree test. You would need to quadruple your sample size (381) to cut your margin of error in half (5%).
| Sample Size | Margin of Error (+/-) |
| 10 | 27% |
| 21 | 20% |
| 30 | 17% |
| 39 | 15% |
| 53 | 13% |
| 93 | 10% |
| 115 | 9% |
| 147 | 8% |
| 193 | 7% |
| 263 | 6% |
| 381 | 5% |
| 597 | 4% |
| 1064 | 3% |
Table 1: Sample size for proportions used to assess findability in tree testing (95% confidence and assumes percentages of 50%).
How many tree test tasks should each participant be asked to perform?
Again, this depends on the complexity of the navigation and difficulty of the items. We typically see around 1-2 minutes per item. We ran a tree test with 14 items which took a median time of 17 minutes, and another study with 30 items it took 53 minutes. This also includes the time for users to answer two post item questions (confidence and difficulty).
Do you have any strategies for incorporating follow up survey questions with tree tests? How do these help to supplement the tree test results?
We ask participants the Single Ease Question (SEQ), which is a standardized measure to assess task difficulty. Because so much of task usability is simply finding the item, we find the percentile ranks offer a good guide as to the usability. An average score is fluctuates between a 4.8 and 5.1 across hundreds of tasks.
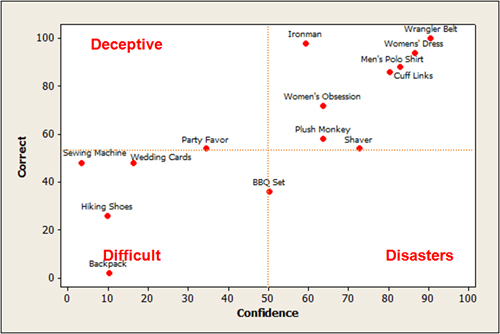
We also ask how confident users were and then associate confidence and completion to generate item “disasters.” The graph below shows the four-block for confidence and completion (correctness). You want as many items in the upper-right as possible.

Figure 1: Crossing confidence with success rate (correct) provides and additional perspective on items users might think they are finding correctly but are not (called disasters).
How do task success rates on a tree test compare with success rates on a live site?
This is a great open-ended research question that we are currently exploring. We’ve examined task-completion rates across dozens of usability studies and found the average completion rate is around 78%. We expect the tree test average to be lower than this for at least two reasons.
- There is no search to help users find the items.
- There are no design elements to help guide users or emphasize more popular choices and increase the “information scent.”
When examining a much smaller sample of just 77 tree test tasks from 200 users across three studies, we found the average completion rate was 66%. Consider this result tentative as we continue to collect more data.
However, we have started running some experiments in which we randomly assign users to find an item in a tree or the live website. Preliminary results from two websites and tree tests (Target and Ikea) show an opposite pattern of what we were expecting. Of the 20 tasks, 17 had higher task completion rates on the tree test! This would suggest that the design elements and possible poor search results may actually hurt the findability more than help it.
Or, there could be a methodological difference in how we assess a successfully found item. Users are finding the right item, but we might not be giving them credit for the correct URL due to possible variations we haven’t accounted for. More data is needed to confirm these findings. In the interim, it’s always good practice to use the same method (tree test or live site) when you run the test again after making changes.


