 What’s a good sushi restaurant in Denver? Is this auto repair shop reliable? What are the best hotels in Oahu that don’t cost a fortune?
Most people, when asking questions about businesses—from travel and leisure to professional services—start online by reviewing one of the many informational websites.
But even if these review websites are usable and useful, can you trust their reviews? Are the websites cluttered with fake reviews from vengeful competitors, disgruntled customers or employees, or even business owners?
The problem of fake reviews is extensive enough that a former federal criminal investigator has started the Fake Review Watch website. Forbes has reported that Tripadvisor rejected or removed more than two million fake reviews in 2020 (8.6% of the total). And the FTC investigates and fines businesses that use fake reviews to mislead consumers.
So, are top review websites usable and attractive? But even more important, are they trustworthy? To find out, we collected UX benchmark data for several leading business information websites. We measured the experience of researching business information for the purposes of 1) deciding to visit a business, 2) exploring available business options, and 3) deciding what to do, purchase, or order at a business.
We collected data on a variety of attitudes and intentions toward several business information websites:
- Google Reviews
- Tripadvisor
- Yelp
We computed SUPR-Q® and Net Promoter scores, investigated reasons for using the websites, measured users’ attitudes regarding their experiences, conducted key driver analyses, and analyzed reported usability problems.
Benchmark Study Details
In June and July 2022, we asked 183 users of business review websites in the U.S. to recall their most recent experience with one of the three websites on their desktop and mobile (app and website) in the past year.
Participants completed the eight-item SUPR-Q (which includes the Likelihood-to-Recommend item that is the basis of the Net Promoter Score) and two-item UX-Lite™ standardized questionnaires and answered questions about their brand attitudes, usage, and prior experiences.
UX Quality of Business Review Websites: SUPR-Q
The SUPR-Q is a standardized questionnaire that is widely used for measuring attitudes toward the quality of a website user experience. Its norms are computed from a rolling database of around 200 websites across dozens of industries.
SUPR-Q scores are percentile ranks that tell you how a website experience ranks relative to the other websites (50th percentile is average). The SUPR-Q provides an overall score as well as detailed scores for subdimensions of Usability, Trust, Appearance, and Loyalty.
The business information websites in this study collectively averaged at the 74th percentile. Tripadvisor received the highest SUPR-Q score at the 95th percentile, and Google Reviews scored the lowest at the 55th percentile.
Usability Scores and Trust
We asked participants to rate how easy they thought it was to use and navigate through the websites. Yelp had the highest usability score (93rd percentile) and Google Reviews had the lowest (42nd percentile). Comments about Google Reviews regarding usability included
- “I wish I could see a breakdown of the user’s reviews star ratings. For example, if a business has fifty 1-star reviews, I would like to be able to see that in a summary section.”
- “It’s confusing to locate the site for my needs. I can only get there through a search on the business.”
- “Only problem is sometimes trusting someone’s rating. Maybe, like on Amazon, have credible users who are ranked as reliable reviewers.”
We also asked participants to rate the trust and credibility of the business information websites. Trust scores were generally lower than the usability scores, except in the case of Tripadvisor. Tripadvisor had the highest trust score (96th percentile). Yelp had the lowest trust score (20th percentile). Based on respondents’ feedback, this may be related to the trustworthiness of the reviews themselves due to various factors. Comments about Yelp included
- “I don’t always trust online reviews in general since I know of businesses that actually pay/bribe customers to change negative reviews to positive.”
- “Sometimes the reviews are fake or they hide critical reviews.”
More verbatim comments are available in the downloadable report.
Loyalty/Net Promoter Scores
The average NPS for the business information websites was 28% (higher numbers of promoters than detractors), ranging from 19% for Google Reviews to 40% for Tripadvisor. In general, a better user experience is a good predictor of customer loyalty.
Yelp Loses Some Trust—2017 vs. 2022
In 2017, Yelp was part of a benchmarking SUPR-Q study. Generally, its scores have improved since 2017, except for the subdimension of Trust. In 2017, Yelp’s trust score was at the 40th percentile, dropping to the 20th percentile in 2022. Participants, in their open comments, provided justification for these lower trust scores. Many participants felt a lack of trustworthiness in Yelp reviews, either because the reviews were inaccurate or because Yelp hid certain reviews without an apparent cause.
Websites and Mobile App Usage
As a part of this benchmark, we asked participants how they accessed the business information websites. All participants reported using their desktop/laptop computers (this was a requirement for participation in the survey), with 51% using mobile apps and 26% using mobile websites.
The typical frequency of use was a few times a year for desktop/mobile websites (on average, about 6% reported daily use). For those who reported mobile app use, typical frequency of use was a few times a month, indicating that mobile app users are more frequent users.
Usage patterns were roughly equivalent for all business information websites, with 26% of participants going to these websites to look at reviews and 17% looking for business information and details (i.e., hours of operation). Other reasons for visiting business information websites include finding a business based on location (12%), planning a visit to the business (11%), looking at business photos (9%), and looking for business recommendations (9%).
Key Drivers of the Business Information Experience
To better understand what affects SUPR-Q scores and likelihood-to-recommend (LTR) ratings, we asked respondents to rate the following attributes of the business information websites on a five-point scale from 1 (Strongly disagree) to 5 (Strongly agree). We conducted key driver analyses (regression modeling) to quantify the extent to which ratings on these items drive (account for) variation in overall SUPR-Q scores and, separately, LTR (the rating from which the NPS is derived).
- The photos are helpful.
- The site can search for businesses by location.
- The reviews are helpful.
- The site can search for businesses by type.
- I’m able to easily review businesses on the site.
- The site can search for businesses by price range.
- The site can search for businesses by reviews.
- It’s easy to apply filters to find different businesses.
- The site recommendations are relevant.
- The site has all the relevant information I need for my visit.
- I’m able to easily upload businesses photos on the site.
- The photos are high quality.
- The reviews are legitimate.
- The site provides useful customer support.
SUPR-Q Drivers. As shown in Figure 1, the top key drivers from this list were “The site has all the relevant information I need for my visit” and “The photos are high quality” (respectively accounting for 16% and 10% of SUPR-Q variation). Other significant key drivers were “The site provides useful customer support” (9% of the variation) and “The site recommendations are relevant,” (7% of SUPR-Q variation).

LTR Drivers. At a high level, the top key driver of likelihood-to-recommend (LTR, the basis of the NPS) was brand attitude (32%).
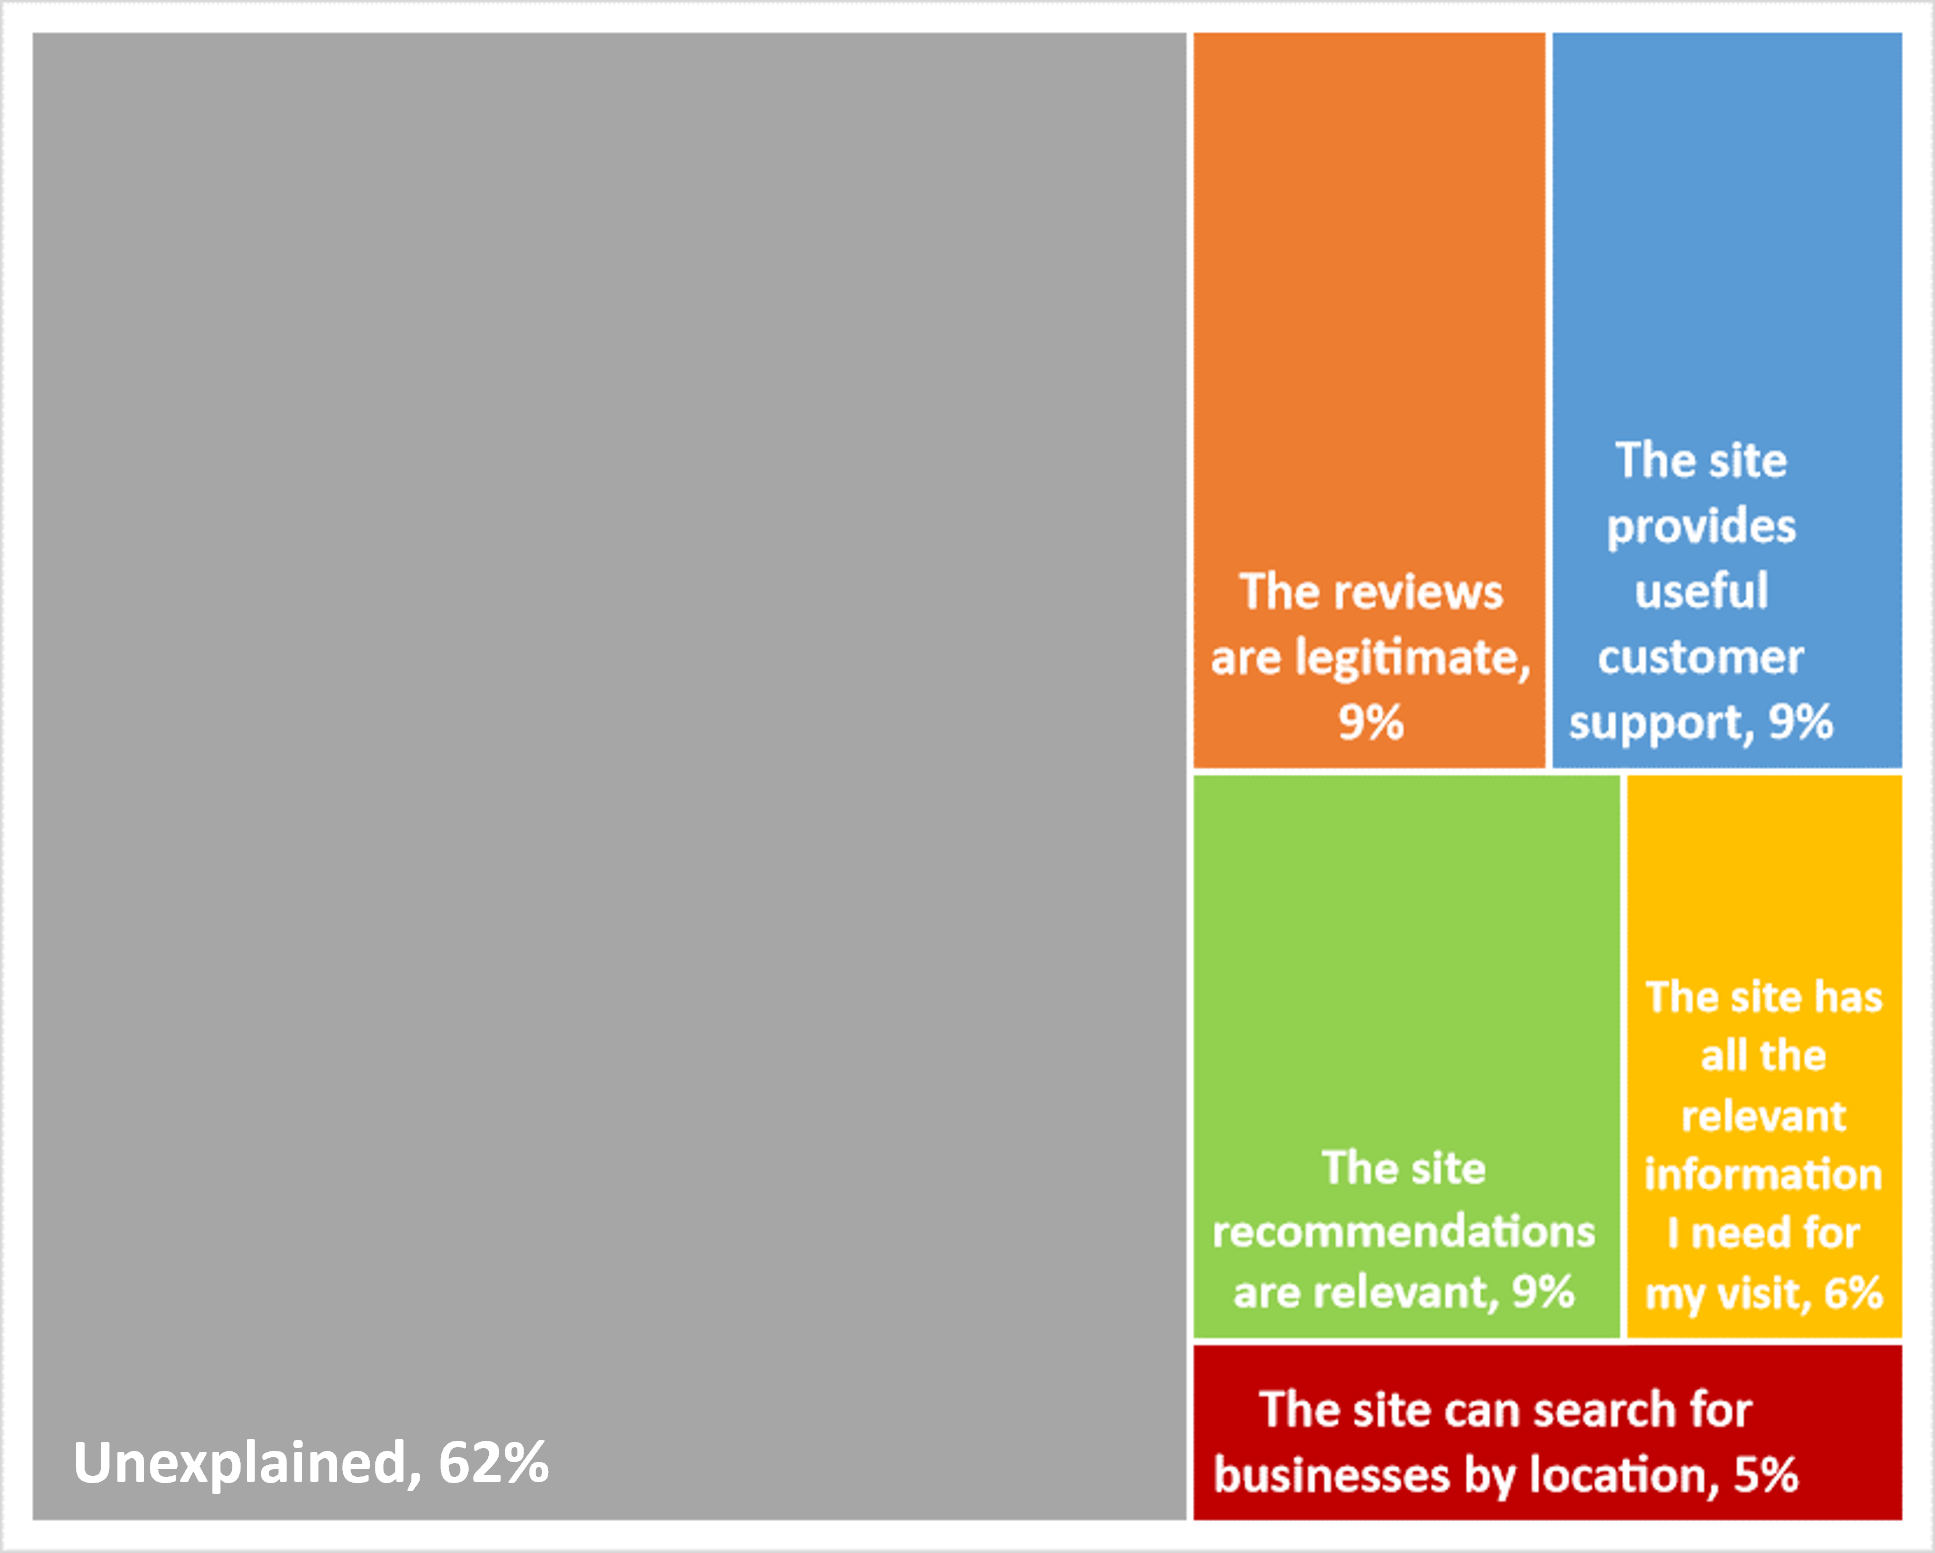
At a lower level (shown in Figure 2), using the same set of predictors as in the SUPR-Q KDA, the top key drivers were “The reviews are legitimate” (9%), “The site recommendations are relevant” (9%), and “The site provides useful customer support” (9%).
Best and Worst: Key Drivers
We did a deep dive on the key drivers to better understand what’s separating the best from the worst performers. In particular, the photo quality and available filters help certain business information websites perform better than others.
Photo Quality
Participants were asked to rate their experience when looking for high-quality photos to support a decision to visit a particular business. Tripadvisor received the highest percentage of participants who strongly agreed (top box) to “the photos are high quality,” at 38%. Google Reviews had the lowest percentage, with only 14% of participants strongly agreeing.
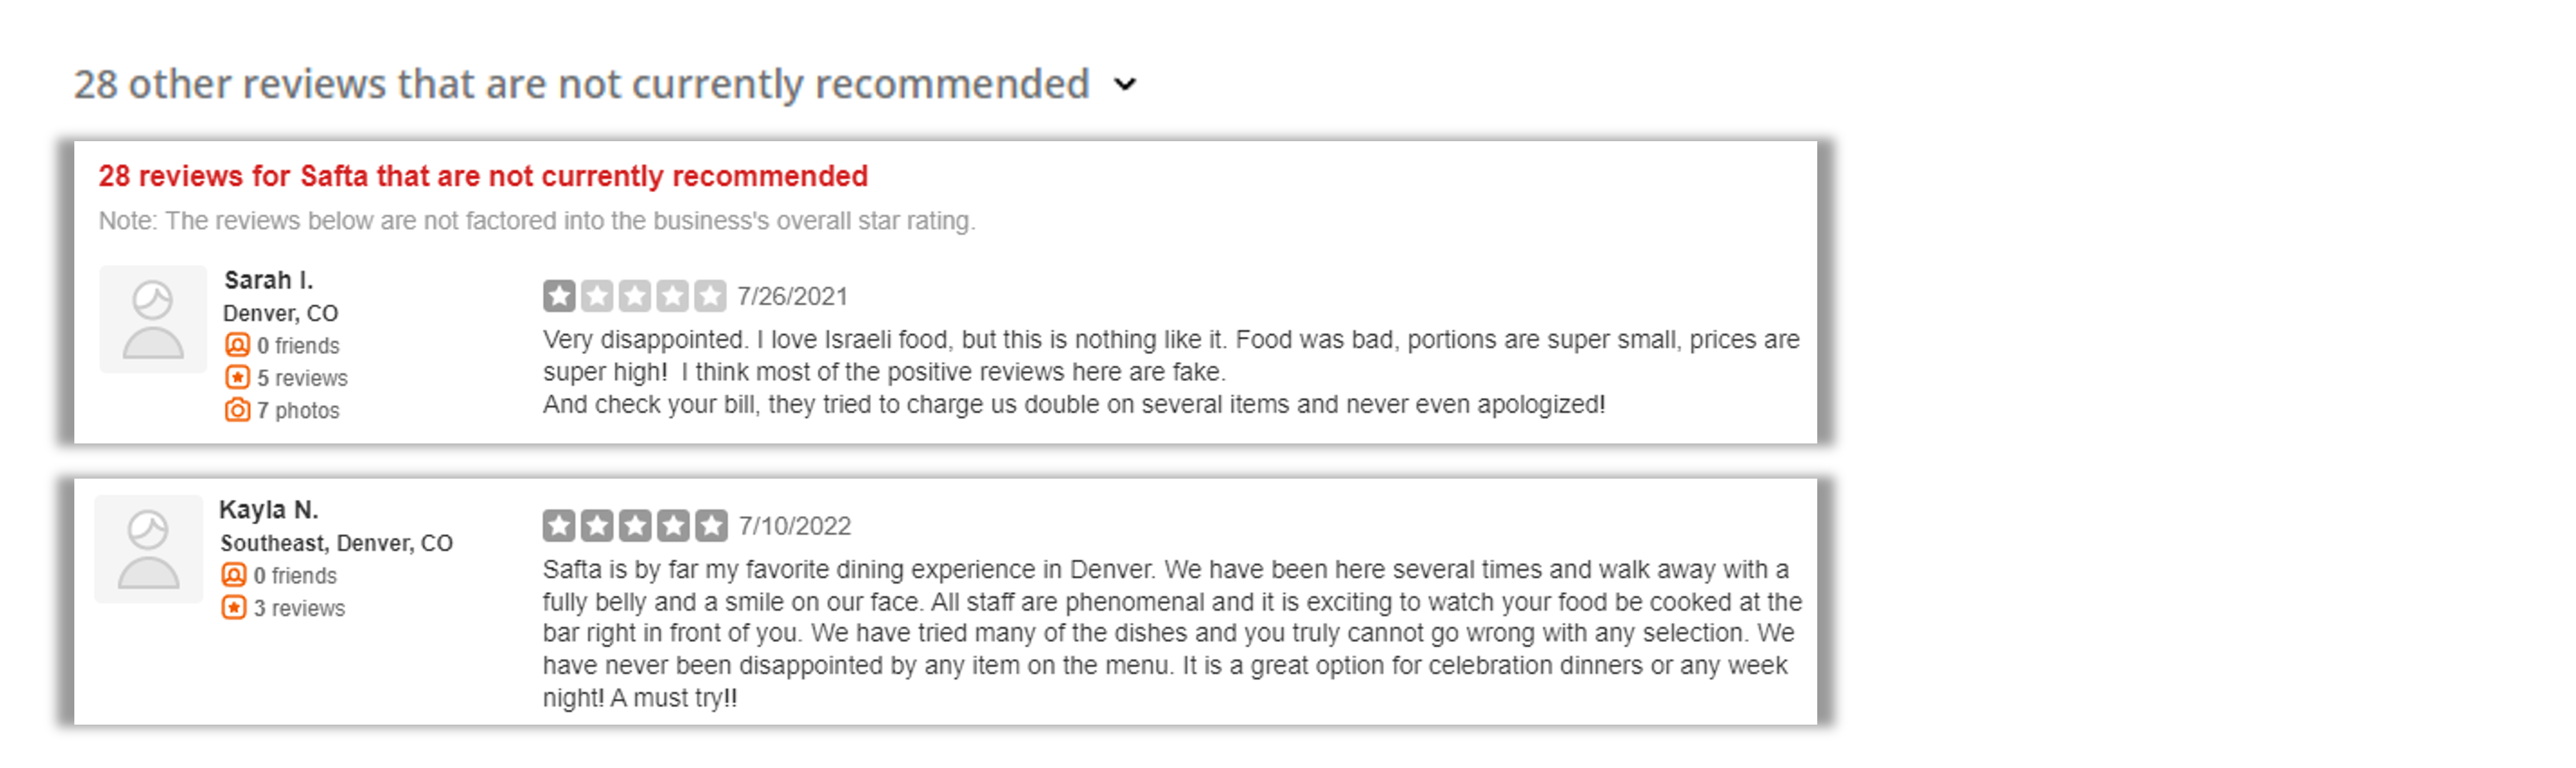
Tripadvisor allows businesses to upload their own photos, which are often professionally taken. Most businesses will upload their best photos, where the food or item is presented cleanly and simply (Figure 3). Google Reviews does not have a central location for photos, so users must scroll through individual reviews. Additionally, the reviews showcase patron’s photos, which vary in quality (Figure 4). However, some users appreciate viewing the true experience (i.e., what the serving size and presentation will actually look like with a particular dish).


Applying Filters
Participants were asked to rate their agreement with the ease of applying filters to find various businesses. Yelp performed the best on this metric, with 39% of participants selecting Strongly Agree while Google Reviews performed the worst, with 22% of participants strongly agreeing.
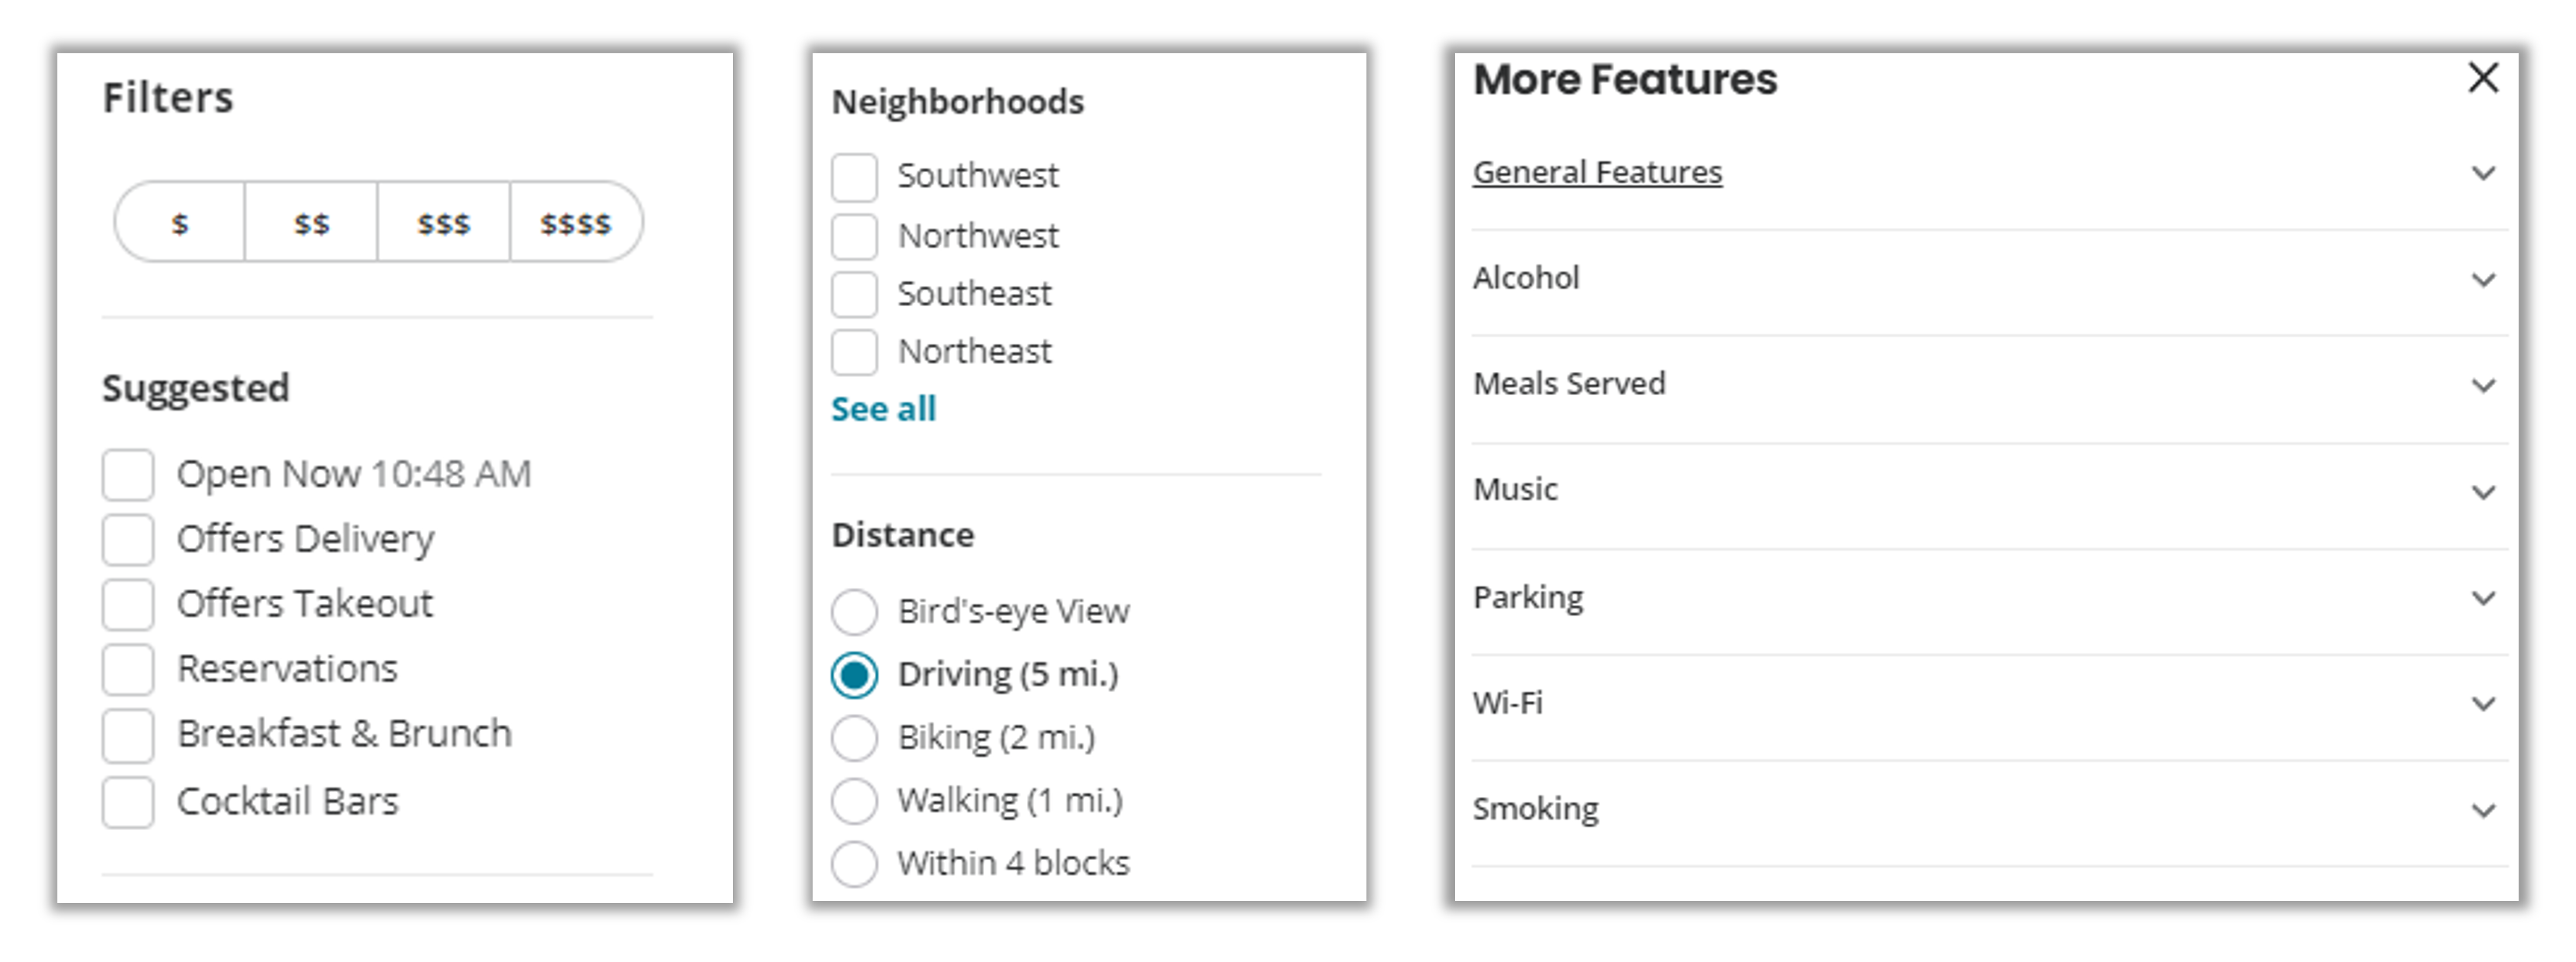
When comparing the filters between Yelp and Google Reviews, Yelp has at least ten filters (Figure 5) while Google Reviews has only four (Figure 6). Yelp also provides unique or niche filters (i.e., outdoor seating or gender-neutral restrooms).

Other Improvement Areas
Respondents had a few other common problems and frustrations across the business information websites, such as 1) trustworthiness of reviews and 2) outdated business information.
Specific key areas of improvement cited by respondents for each website/app include
- Google Reviews: “I think it takes time to look for a specific review on a certain topic you want to know—i.e., parking spaces, how long to be served.”
- Tripadvisor: “Often restaurant prices are going up. It might say $, but then you get there and find out that you were looking at a menu from five years ago.”
- Yelp: “I do not like how Yelp filters certain reviews. Sometimes their algorithm catches real, genuine reviews and marks them as hidden. Overall, this degrades the view of the business.”


Summary and Takeaways
Our analysis of the user experience of three business information websites found that
-
- SUPR-Q scores were above average, and mean NPS was 28%. Tripadvisor had the highest SUPR-Q rating (95th percentile), and Google Reviews had the worst (55th percentile). Tripadvisor had the highest NPS (40%), and Google Reviews had the poorest (19%).
- Top key drivers of the SUPR-Q were related to ease of use and usefulness. The top key SUPR-Q drivers were “The site has all the relevant information I need for my visit” and “The photos are high quality” (respectively accounting for 16% and 10% of SUPR-Q variation).
- Variation in likelihood-to-recommend ratings was related to usefulness and trust in reviews. Using the same set of low-level predictors as in the SUPR-Q KDA, the top key drivers (each accounting for 9% of variation) were “The reviews are legitimate,” “The site recommendations are relevant,” and “The site provides useful customer support.”
- Trust in reviews may affect changes in SUPR-Q trust ratings over time. In addition to being a top driver of likelihood-to-recommend, the decreasing trust in online reviews may explain the drop in scores for Yelp, whose trust scores have declined since our 2017 study of this type of website.
- Some UX issues were common across the websites. Respondents had a few common problems and frustrations across the business information websites, such as 1) trustworthiness of reviews and 2) outdated business information.
Full details are available in the downloadable report.