 If you build it, they will come.
That may work for a field of dreams. But when it comes to software and products, if you want people to stay and use the product, it had better be useful and usable. Or, at least, the users should think that it will be useful and usable.
That’s the idea behind the Technology Acceptance Model (TAM), which was developed in the mid-1980s to help information systems researchers understand why some technologies succeed and others fail to be adopted in organizations.
Research on the TAM has generally found that users’ beliefs that a new technology will be useful (perceived usefulness) and usable (perceived ease-of-use) affects, in order, attitudes toward use, the intention to use, and actual use.
And how do you measure perceptions of usefulness and usability? The original TAM had twelve items (six for perceived usefulness and six for perceived ease-of-use), but since its inception decades ago, it has been modified several times, including by reducing the number of items for each construct from six to four and by adapting it as a retrospective measure of actual experience (mTAM) rather than measuring the likelihood of future use.
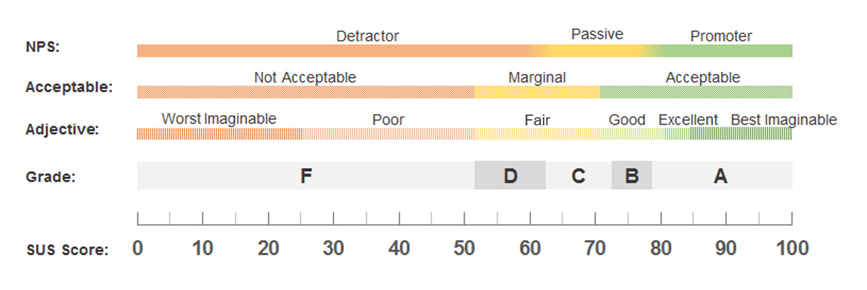
For measuring perceptions of usability, the most popular questionnaire is the ten-item System Usability Scale (SUS). Well-established public benchmarks for the SUS help organizations differentiate between great, mediocre, or poor usability (see Figure 1).
Measures of usefulness have not been used as frequently in UX research. But one recent questionnaire that measures both usefulness and usability is the two-item UX-Lite™. Its evolutionary path goes back to the UMUX-Lite, which was itself derived from the four-item UMUX.
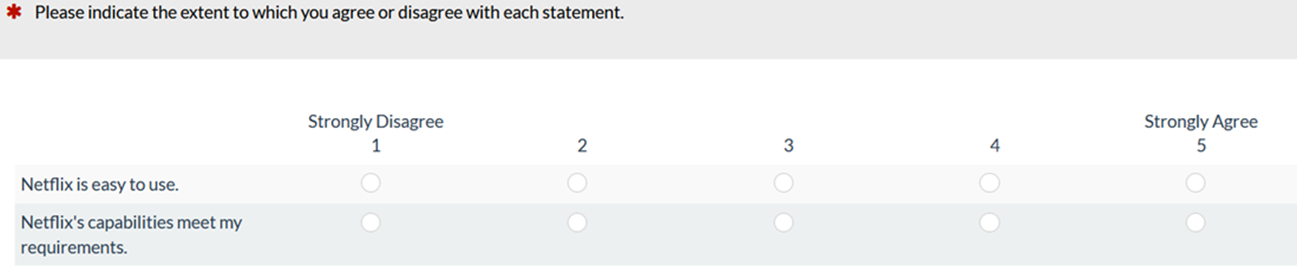
As shown in Figure 2, one item assesses perceived ease-of-use (Ease) and the other assesses perceived usefulness (Useful), making it a miniature version of the TAM.
The UX-Lite is certainly a lot shorter than the SUS (two vs. ten items), and it captures two constructs, but losing the ability to compare against SUS benchmarks is a legitimate concern.
In this article, we describe three ways to estimate SUS scores from five-point UX-Lite or seven-point UMUX-Lite data.
Three Approaches to Generate SUS Scores
We settled on three approaches that either have been used in previous research or seemed reasonable for estimating SUS scores:
- Scaling the mean of both items to a 0-100-point scale (two-item interpolation)
- Scaling just the Ease item to a 0-100-point scale (one-item interpolation)
- Using a regression equation derived from just the Ease item (one-item regression)
Approach 1: Two-Item Interpolation
This is the method that has previously been used to assess the correspondence between concurrently collected UMUX-Lite and SUS scores. Basically, compute the mean of the two items, subtract 1, then multiply by the fraction needed to produce a maximum score of 100. Here are the formulas for the UMUX-Lite (assuming a seven-point scale) and the UX-Lite (assuming a five-point scale).
- UMUX-Lite = (((Ease + Useful)/2) − 1)(100/6)
- UX-Lite = (((Ease + Useful)/2) − 1)(100/4)
For example, Lewis (2019) collected UMUX-Lite (seven-point scale) data for four everyday software products. For Amazon, the Ease mean was 6.15 and the Useful mean was 6.24. Applying the equation above, the mean UMUX-Lite equals 86.6. (The concurrently collected SUS mean was 84.8, 1.8 points less than the estimate.)
In 2019, we conducted a survey on the UX of consumer software. One product we collected data for is Norton Antivirus, which had a UX-Lite (five-point scale) Ease mean of 4.00 and a Useful mean of 4.03. Combined, they produce a UX-Lite score of 75.4. (The concurrently collected SUS mean was 73.5, making the estimate 1.9 points higher than the SUS score—within 2%).
Approach 2: One-Item Interpolation
A second approach to predict SUS is to use just the Ease item. We will lose some fidelity by not having two items, but it seems more theoretically sound to use only an Ease item to predict a score similar to the SUS, which primarily measures ease. To interpolate the UMUX-Lite (seven-point scale) or UX-Lite (five-point scale) to a maximum of 100 points, use these formulas:
- UMUX-Lite: EaseInt100 = (Ease − 1)(100/6)
- UX-Lite: EaseInt100 = (Ease − 1)(100/4)
Continuing to use the Amazon and Norton results as examples, the estimates using this method were
- Amazon: EaseInt100 = (6.15 − 1)(100/6) = 85.8
- Norton: EaseInt100 = (4.00 − 1)(100/4) = 75.0
With this approach, the concurrently collected SUS for Amazon (84.8) was 1 point lower than the estimate (85.8). The concurrently collected SUS for Norton Antivirus (73.5) was 1.5 points lower than the estimate (75.0).
Approach 3: One-Item Regression
Two results from previous research suggest it might be advantageous to estimate SUS scores from Ease ratings. In the original UMUX paper (Finstad, 2010), the reported correlation between Ease and SUS was a highly significant .81. In 2018, Sauro also found a highly significant correlation between the Ease item and the overall SUS (r = .95, from an analysis of means from ratings of 148 products and websites) and published the associated regression formula for estimating SUS from Ease.
The following formulas show how to estimate SUS from the Ease item of the UMUX-Lite or the UX-Lite. Note that the formula for a seven-point version (UMUX-Lite) uses the same intercept and slope as for the five-point version published by Sauro but includes additional elements to interpolate the seven-point rating to five points.
- UMUX-Lite: EaseReg100 = −2.279 + 19.2((Ease − 1)(4/6) + 1)
- UX-Lite: EaseReg100 = −2.279 + 19.2(Ease)
Using the Amazon and Norton data for examples, the estimates using this approach were
- Amazon: EaseReg100 = −2.279 + 19.2((6.15 − 1)(4/6) + 1) = 82.8
- Norton: EaseReg100 = −2.279 + 19.2(4.00) = 74.5
The concurrently collected SUS for Amazon (84.8) was 2 points higher than the estimate (82.8), and the concurrently collected SUS for Norton (73.5) was 1 point lower than the estimate (74.5).
Interpolation versus Regression
Interpolation could be advantageous over regression because it can produce values over the full range of 0 to 100, and it is not tied to a specific set of data to establish its y-intercept and slope. On the other hand, a regression equation derived from a sufficiently large dataset of products with a very wide range of levels of perceived usability might, by virtue of minimizing error through least squares, be more accurate than interpolation. In this article, we refer to the Ease interpolation metric as EaseInt100 and the regression metric as EaseReg100, either of which could be used to estimate SUS. Table 1 shows the estimates from the examples used in this article.
| Product | Ease | Useful | (UM)UX-Lite | EaseInt100 | EaseReg100 | Mean SUS |
|---|---|---|---|---|---|---|
| Amazon | 6.15 | 6.24 | 86.6 | 85.8 | 82.8 | 84.8 |
| Norton Antivirus | 4 | 4.03 | 75.4 | 75 | 74.5 | 73.5 |
Table 1: Estimates from the Amazon and Norton examples.
Table 1 shows only two examples, one UMUX-Lite and one UX-Lite, so although all three approaches appear to estimate the SUS reasonably well (within 2 points), it will take more data to determine which one works the best.
In a future article, we will compare the accuracy of these three approaches with data from the published literature of the UMUX-Lite and data we’ve collected with the UX-Lite over the past four years.
Key Takeaways and Discussion
The SUS has a long history of being used to measure perceived usability with well-established benchmarks. At ten items, it’s a bit long for a unidimensional measure, especially if it is asked multiple times in a study.
Any new measures of perceived usability that have fewer items and can leverage these existing SUS benchmarks would be valuable to UX researchers. Indeed, those were the key goals of the UMUX, which were inherited by its later variants the UMUX-Lite and the UX-Lite.
Although the historical approach to estimating SUS from UMUX-derived metrics has been to compare UMUX-Lite with SUS, it is possible (and would be more theoretically satisfying) that estimation may be as accurate or more so when you use just the Ease item. As a first step in investigating this, we have developed three approaches to estimating SUS from either the UMUX-Lite or the UX-Lite.