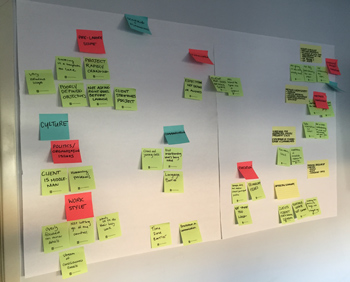
 The affinity diagram is a visual technique to organize ideas and information.
The “affinity” between pieces of information reveals patterns and often a hierarchy that can help with product design (similar to the affinity or basket analysis).
It’s also known as the K-J method for its creator, Jiro Kawakita, who developed it as one of his seven quality tools in the 1960s. Jiro was a cultural anthropologist, so that gives some clue as to its origination and continued use in user research.
Affinity diagramming is an inductive technique in that you start from the bottom with fragments of ideas, behaviors, and observations and end up with “top” groups and relationships.
Its main benefit is in taking what may seem like disconnected information and finding potentially hidden associations and patterns to reveal latent themes using a low-tech and quick approach.
How to Create an Affinity Diagram
Here’s the process for putting together an affinity diagram using a recent exercise our team did on providing better service for our clients.
- Brainstorm ideas: Add each idea to individual sticky notes or index cards with pins (or use a digital equivalent).
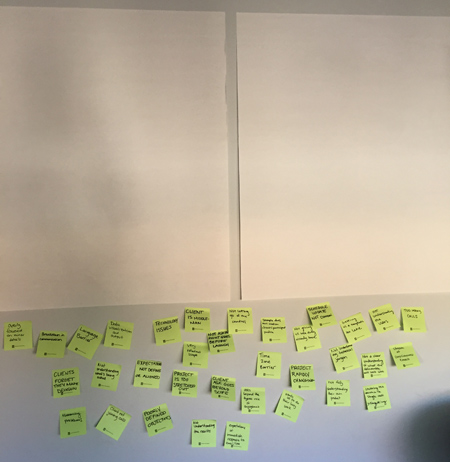
- Group like notes together: Place notes that convey a similar concept together. It’s like a card sort for ideas. Place like groups together, too. As you go along, hierarchies and relationships will start to form.
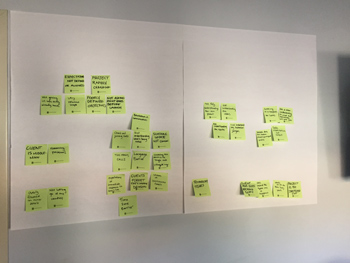
- Name each group: Using different color sticky notes, give a name to the individual groups and collective groups. Optionally, you can include arrows to show relationships between the groups, depending on the types of relationships (one to one, one to many, many to many). In our exercise we didn’t use arrows.
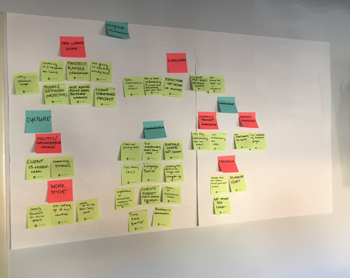
- Take the affinity diagram one step further: If there aren’t too many items to group and enough evaluators, have people independently group and sort the items and then create a similarity matrix to quantify the agreement in the relationships.
When to Use an Affinity Diagram
Anytime there’s a lot of disconnected information, an affinity diagram can help, such as in these cases:
-
- When you’re observing behaviors: Describe what people do and say after observing them in a contextual inquiry.
- After you’ve been brainstorming: Sort ideas that come from co-workers or customers on new functions, processes, or products (like our example above).
- When you’re analyzing verbal data from survey results: Group similar answers to open-ended comments into groups to understand themes.
- When you need to sort usability problems: Often usability problems have common causes and the experience users have are just symptoms of the same underlying issue. The affinity diagram can help uncover root causes by identifying themes in the problems and possible design solutions.
- When designing user interfaces: Beyer and Holtzblatt recommend the affinity diagram as a key method for designing better systems in their book Contextual Design.
Things to Consider with Affinity Diagrams
Before you embark on an affinity diagram, keep these things in mind:
-
- Sticky Notes Work Well: People tend to use sticky notes for affinity diagrams for a few reasons.
- They are easy to stick AND move around.
- They have just enough space to write the info you need, without going overboard.
- They are plentiful in offices, come in many colors, and are usually free at trade shows, like the ones we used (thanks Optimal Workshop!), or inexpensive to buy.
- Schedule time. It can take a few minutes to days to organize an affinity diagram, depending on whether you have a few dozen or hundreds of notes. The exercise we conducted took us two hours.
- Decide whether to brainstorm individually or as a team. Some make an argument for not talking during a sorting session; there are benefits to doing this exercise in isolation and aggregating the results to benefit from group judgment. But that rule is too context specific for all to follow; talking out loud helps reduce redundancy and ensures the fragments are clear and understandable.
- Find more associations with advanced techniques. The book, Rapid Solving with Post-it Notes, has all sorts of ideas on how to use sticky notes. A helpful one is to use the FOG method. You label each of the notes with one of the letters, F, O, or G. They stand for:
- Fact: Information that can be verified empirically.
- Opinion: Often mistaken for facts but can still be useful to get your ideas out there and later challenged.
- Guess: Can be wild ideas but helpful when coming up with new designs or features (and ideally later verified).
- Sticky Notes Work Well: People tend to use sticky notes for affinity diagrams for a few reasons.
Creating an affinity diagram is a good first step for organizing seemingly disconnected information. It can be low-tech (sticky notes) or high-tech if you want to make it digital (and potentially involve remote members). Because it is done in a group, it also has the added benefit of allowing people to have a voice and contribute ideas.

