 There is plenty of debate about the best way to quantify attitudes and experiences with rating scales. And among those debates, perhaps the most popular question is the “right” number of response options to use for rating scales. For example, is an eleven-point scale too difficult for people to understand? Is a three-point scale insufficient for capturing extreme attitudes?
Most research on this topic shows that if the scale (1) can measure the direction of the response (e.g., disagree vs. agree), (2) can provide some indication of the magnitude of the response (e.g., agree vs. strongly agree), and in most UX research, (3) has a neutral position, it will have sufficient reliability and sensitivity (keeping in mind that increasing the number of response options usually increases reliability up to eleven points). To meet these requirements for single-item measures, you need a minimum of five response options. When combining item responses into multi-item scores, you can usually get by with a smaller number (e.g., the SUMI uses 50 three-point items).
Because there is no compelling reason to decide the “right” number of response options, different researchers can legitimately make different decisions. That’s fine when focusing just on their research, but what if they need to compare their results with data collected by researchers who made a different decision? In particular, how can you compare data collected with five-point scales in one study and seven-point scales in another?
In 2013, one of us (Jim) was working with a large client who had multiple UX research departments. The enterprise wanted to standardize the number of response options used in various studies and surveys, but each department had a long history of using five-point scales in one area and seven-point scales in another. A compromise was to investigate whether linear interpolation between the scales would provide a reasonable way to show their essential equivalence when computing means (which turned out to be the case).
What Is Linear Interpolation?
Interpolation is the process of assigning a value to an unknown point that lies between two other points. You can do this with any function, but the simplest way is to do the assignment with a straight line (linear interpolation). This might not always be the most accurate interpolation, but because most of the functions that occur in UX have strong linear components, it usually works very well.
When you convert a scale using linear interpolation, the mean will change, as will the standard deviation. However, linear interpolation will not affect the results of standard statistical operations such as correlations, t-tests, linear regression, or analysis of variance.
How to “Misinterpolate” (And How to Avoid It)
Consider a common approach to converting five-point scales to percentage responses by dividing each response option by the maximum value of five. The resulting values are
| x | 1 | 2 | 3 | 4 | 5 |
|---|---|---|---|---|---|
| x/5 | 20.0% | 40.0% | 60.0% | 80.0% | 100.0% |
Table 1. “Misinterpolating” a five-point scale to percentages.
As expected, the percentage when x = 5 is 100%, but there’s a problem. The lowest percentage is 20% instead of 0%, increasing by 20% increments up to 100%. This “misinterpolation” happened because these types of scales commonly start at 1 instead of 0.
If you adjust the five-point scale so it goes from 0 to 4 and divide each response option by the maximum value of 4, you get values that start at 0% and increase in 25% increments up to 100%.
| x-1 | 0 | 1 | 2 | 3 | 4 |
|---|---|---|---|---|---|
| (x-1)/4 | 0.0% | 25.0% | 50.0% | 75.0% | 100.0% |
Table 2. Properly converting a five-point scale to percentages.
So, when using linear interpolation to convert one scale to another, keep in mind that if the scales don’t include 0, you will have to adjust them.
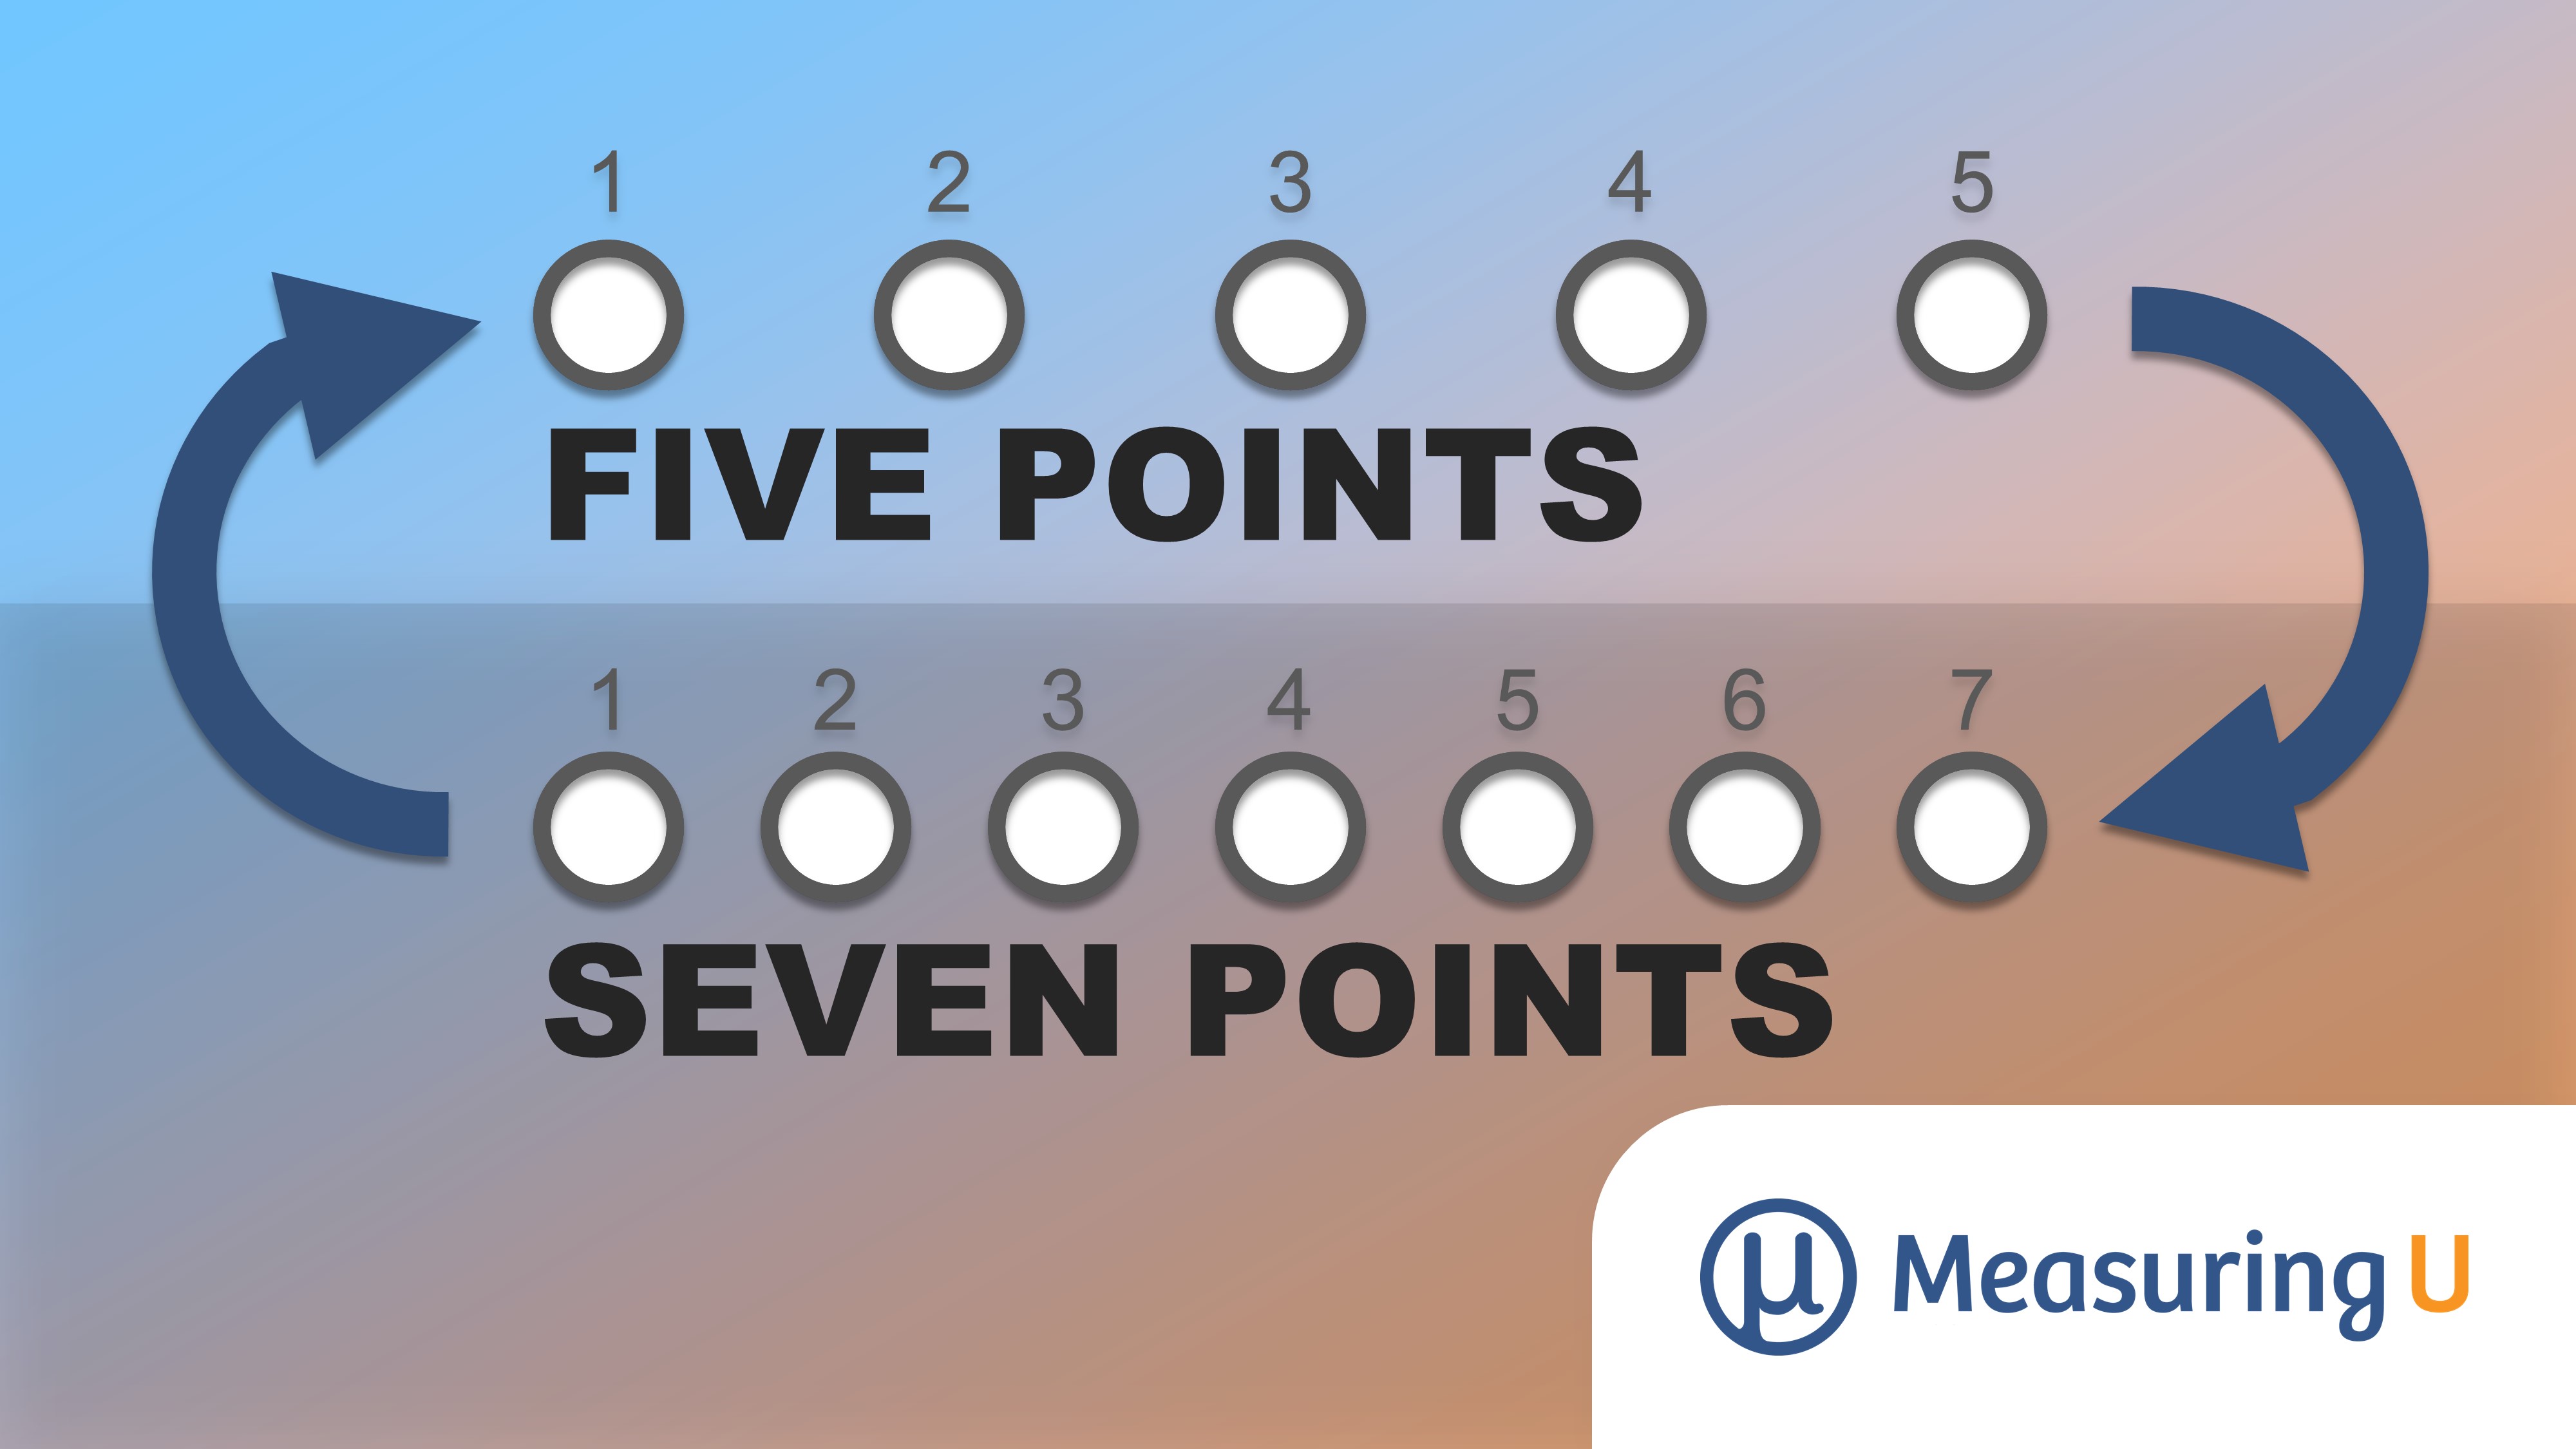
Converting between Typical Five- and Seven-Point Scales
One of the most common scale conversions is from five points to seven points and vice-versa. The most common versions of these scales have response options from 1–5 and 1–7, neither of which include 0 (Figure 1).
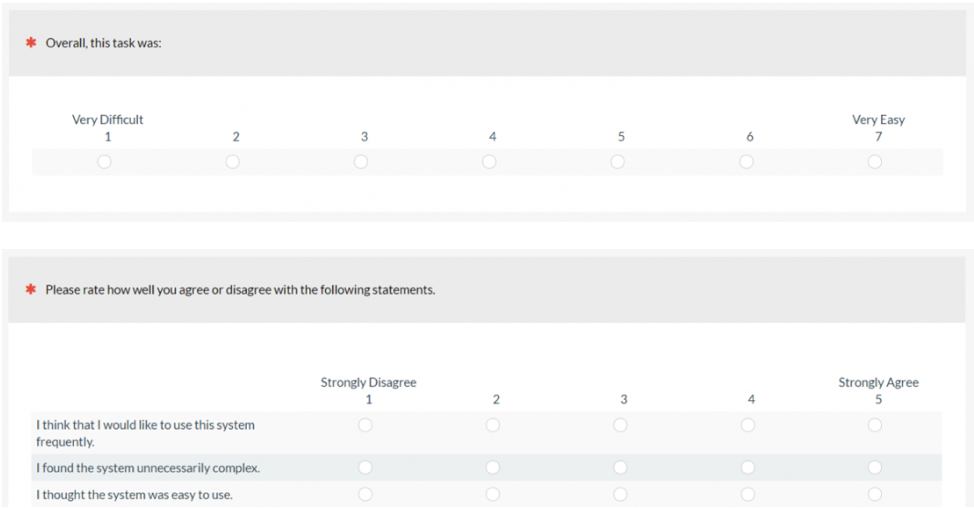
Figure 1. Examples of seven- and five-point scale items.
To convert five-point ratings to seven, you need to (1) adjust the scale to start at 0, (2) stretch the scale, and (3) adjust the scale again to start at 1. This process expressed as a formula is:
x7 = (x5 – 1)(6/4) + 1
The formula works like this:
- Subtract 1 from the five-point rating (to adjust the scale to start at 0).
- Multiply by 6/4 (the maximum value of a 0–6 point scale divided by the maximum value of a 0–4 point scale), which stretches the scale.
- Add back the 1 (to adjust the scale again).
Table 3 shows the application of this formula. When doing this type of conversion, always check that the first, middle, and last values match up as expected.
| Five-point | 1 | 2 | 3 | 4 | 5 |
|---|---|---|---|---|---|
| Seven-point | 1.0 | 2.5 | 4.0 | 5.5 | 7.0 |
Table 3. Conversion from five to seven points.
To go the other direction, from seven to five points, the elements in the formula get switched around a bit:
x5 = (x7 – 1)(4/6) + 1
In the formula above, you subtract 1 from the seven-point rating, compress it by multiplying by 4/6, and then add back the 1. Table 4 shows the results of applying this formula.
| Seven-point | 1 | 2 | 3 | 4 | 5 | 6 | 7 |
|---|---|---|---|---|---|---|---|
| Five-point | 1.00 | 1.67 | 2.33 | 3.00 | 3.67 | 4.33 | 5.00 |
Table 4. Conversion from seven to five points.
If you have two means of similar items from different studies, one using a five-point scale and the other using a seven-point scale, you can use these formulas to convert them (actually, all you need to do is convert one of them to compare to the other). For example, if µ5 = 2.73 and µ7 is 3.5, then the seven-point interpolation of the five-point mean of 2.73 is 3.6 (compared to 3.5). If you prefer converting the other way, the five-point interpolation of the seven-point mean of 3.5 is 2.67 (compared to 2.73).
You can adapt this approach to convert between any scales that start with 1, for example, converting a three-point scale (1–3) to a nine-point scale (1–9).
Summary and Takeaways
Because there is no firm empirical basis for absolutely determining the “right” number of response options for scales used in UX research, researchers don’t always make the same decisions. This doesn’t mean that it’s impossible to compare research conducted with different numbers of response options—you just need to use linear interpolation to convert the scales.
Avoid “misinterpolation” errors that occur when converting multipoint scales that start with 1 instead of 0, such as with standard five- and seven-point scales. When converting these types of scales, start with an arithmetic adjustment to start at 0; then, if necessary, after stretching or compressing the scale, restore the original lowest value by adding 1.