 There’s a lot of conventional wisdom floating around the Internet about rating scales.
What you should and shouldn’t do. Best practices for points, labels, and formats. It can be hard to differentiate between science-backed conclusions and just practitioner preferences.
In this article, we’ll answer some of the more common questions that come up about rating scales, examine claims by reviewing the literature, and summarize the findings from our own studies.
1. Rating scales vary quite a bit. Before digging into the research on rating scales, it’s important to remember that there are many types of rating scales—in fact, we described 15 of them in an earlier article. Often research findings apply to one type and not the other (for example, linear rating scales vs. frequency scales/scoring rubrics).
-
Linear rating scales include the popular eleven-point Likelihood-to-Recommend item (for the NPS), the seven-point Single Ease Question (SEQ), and five-point Likert agreement scales used in the SUS and SUPR-Q.
Figure 1: Examples of linear numeric scales: Likelihood to Recommend (top), Single Ease Question (middle), and Likert scales from the System Usability Scale (bottom).
Frequency scales, such as the one in Figure 2, are common for assessing experience with a product or brand.
Figure 2: Example of a frequency scale.
2. More scale points increase reliability but with diminishing returns. In general, the more points a rating scale has, the more consistent (reliable) responses will be. You get the biggest increases in reliability when you go from three to five to seven, but there’s little to gain beyond eleven points. Jum Nunnally made this point in his seminal 1967 book Psychometric Theory.
At around the same time, some applied researchers questioned this finding. For example, Matell and Jacoby (1971) argued in the aggressively titled “Three-Point Likert Scales Are Good Enough” that reliability and validity were fine with the three-point items they tested. However, their conclusion was based on averaging together results from a questionnaire with 60 items! Our literature review of 12 studies found their conclusion to be an outlier, with other studies confirming that more points do increase reliability, again with diminishing returns. The number of points really matters the most when you have a few items, or only one item (e.g., SEQ, LTR, and UMUX-Lite); when you’re averaging together several items, the number of points matters less. See Jim’s recent article on varying points in UX measures: Points don’t matter (unless you use only three).
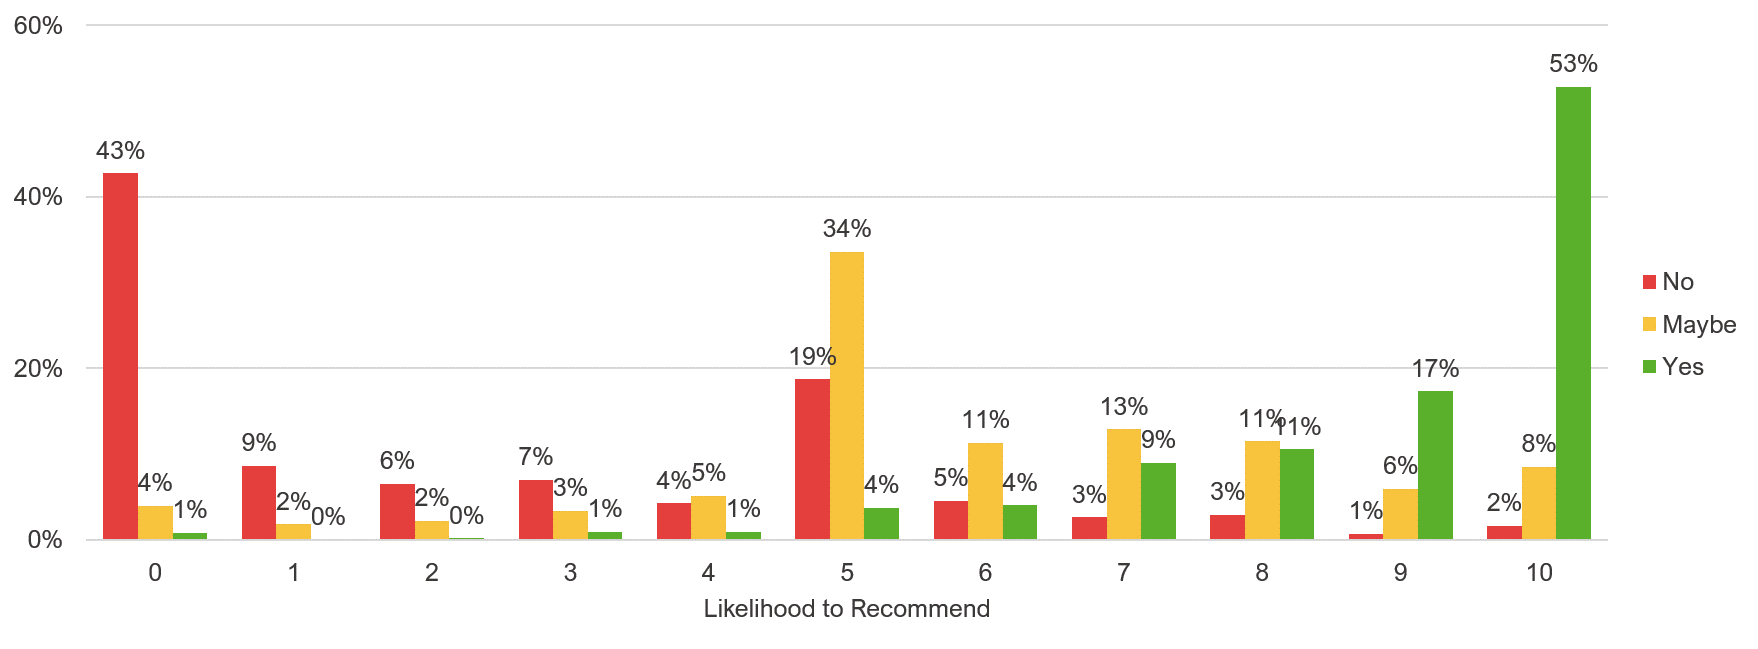
3. More points also increase validity. The “three is all you need” claim has a certain appeal. It sounds like less effort for a respondent. Not surprisingly, some practitioners still recommend using three or even fewer points despite the clear findings in the literature. Or, in the case of the Net Promoter Score, just using a three-point scale and skipping the conversion from eleven points. However, not only do three-point scales have lower reliability, they tend to have lower validity because three-point scales (e.g., No, Maybe, Yes) can’t differentiate between tepid and extreme attitudes. Not all Yeses and Noes are the same, as you can see from the results of three studies in which we had 1,737 participants respond to a three-point and the original eleven-point version of the Likelihood-to-Recommend item.
Figure 3: Response distributions for three- and eleven-point versions of Likelihood to Recommend.
More extreme attitudes (10s and 0s) tend to be a better predictor of behavior. With only three points, you lose the ability to predict behavior (losing validity). The “three points are all you need” advice reminds us of the recommendation from the early 2000s to have all content within three clicks of a website’s homepage. Both have a certain appeal, but the evidence doesn’t support it.
4. Neutral points can affect response patterns but are fine to use. Influential research by Presser and Schuman (1980) [pdf] and Bishop (1987) found that including a neutral option attracts between 10–20% of respondents. This can have significant implications if important decisions are being made based on the percent of respondents who agree to statements. Consequently, some researchers are concerned about the impact of using neutral points in rating scales. However, the topics they studied include relatively sensitive political topics such as funding for social security and defense spending. In UX research, having a neutral attitude about an experience is certainly plausible when the topic is not terribly controversial. Furthermore, as shown in the table below, most UX questionnaires we work with have a neutral point to capture that neutral sentiment (the center option when there are an odd number of response options).
| Questionnaire | Number of Response Options |
|---|---|
| SUS | 5 |
| PSSUQ | 7 |
| SUMI | 3 |
| QUIS | 9 |
| SUPR-Q | 5 |
| UMUX-Lite | 5 or 7 |
| SEQ | 7 |
| LTR/NPS | 11 |
Table 1: Number of response options used in popular standardized UX questionnaires.
What’s more, these questionnaires are scored by averaging responses, usually across multiple items, and then computing and comparing means over time or against benchmarks. Therefore, individual response patterns likely matter less. There’s nothing wrong with having a neutral point (in fact you probably should), but the most important thing is to be consistent.
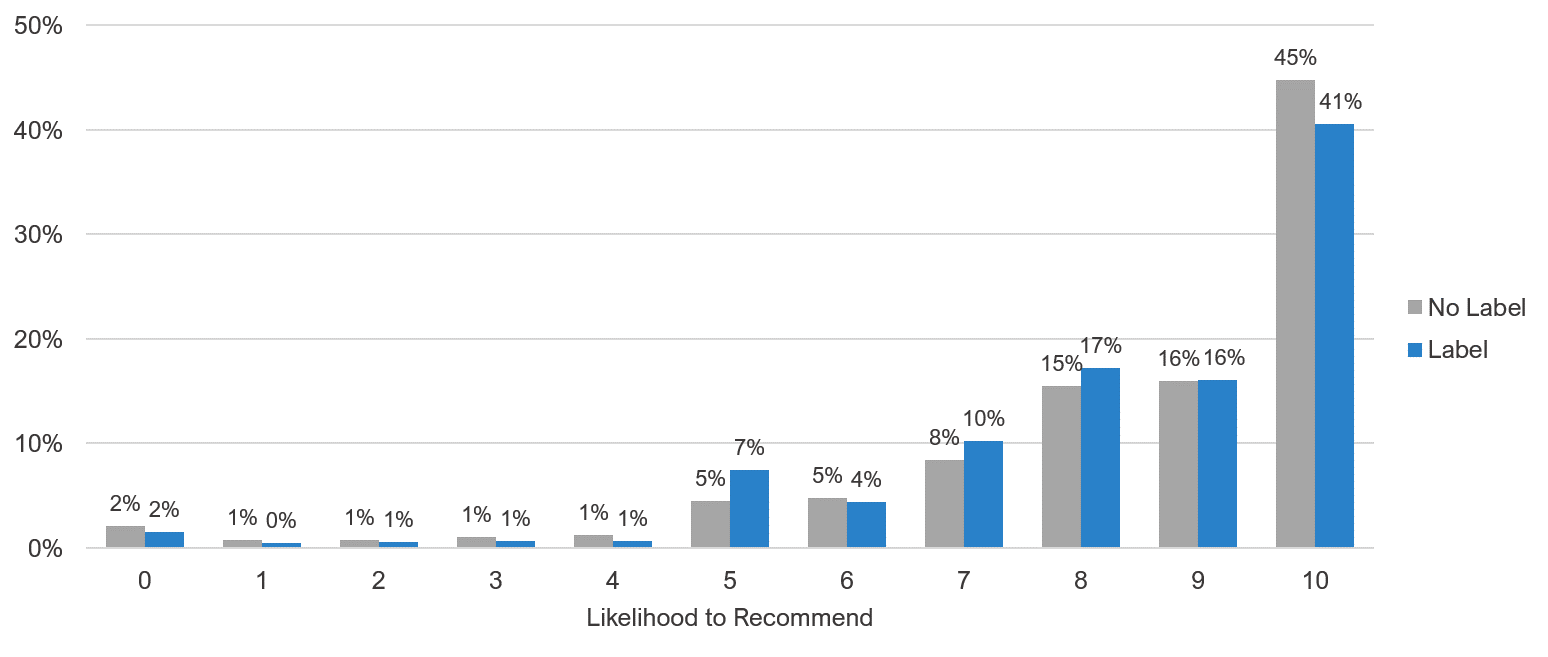
5. Labeling neutral points has a small effect on tepid respondents. A follow up to the neutral point concern is whether to label this midpoint. We conducted two studies (mix of between- and within-subjects) totaling 2,704 respondents where we varied whether the eleven-point LTR item had a neutral label. We found some evidence the label attracted responses, but mostly when we asked respondents who had not made a purchase from the company. The difference largely disappeared when we looked at responses from customers only. For both customers and non-customers, there was little effect on computed Net Promoter Scores.
Figure 4: Response distributions for Likelihood to Recommend with and without explicit labeling of the neutral response option.
6. Use all positive items in questionnaires (in most cases). It’s been a convention for decades to use a mix of positively and negatively worded items in questionnaires. The idea is that this alternating minimizes acquiescent bias (people just agreeing to whatever you ask). For example, two items from the ten-item System Usability Scale (SUS) are shown below, the first positive and the second negative. The same five-point agreement scale is used so this alternating requires respondents to disagree with negative statements if they think the experience was good. What’s more, researchers need to reverse-code these items for scoring and to perform any reliability or factor analysis.
Figure 5: Examples of positive- and negative-tone items from the SUS.
Unfortunately, ours and other research has found that the cure is far worse than the problem. While we found little evidence of the acquiescent bias, we found three undesirable outcomes we call the three Ms: Respondents are more likely to MISINTERPRET negative items and make MISTAKES when responding, and researchers have occasionally been found to MISCODE the scores (forgetting to reverse code). Additionally, these negative items can distort the factor structure. For example, in 2009 we reported finding the SUS had two factors that we called learnability and usability, and this finding was even replicated by other researchers. However, based on our more recent research, it turns out the two factors were just artifacts created by the positive and negative items and not anything meaningful! Unless you’re specifically measuring a negative construct (for example, depression), you should plan to include only positively worded items.
Note that this recommendation applies to the tone of the item statements (see Figure 5), not to the labels of the endpoint responses, which need to have a negative/positive contrast (e.g., “Very dissatisfied” vs. “Very satisfied” or “Strongly disagree” vs. “Strongly agree”) to measure attitudes.
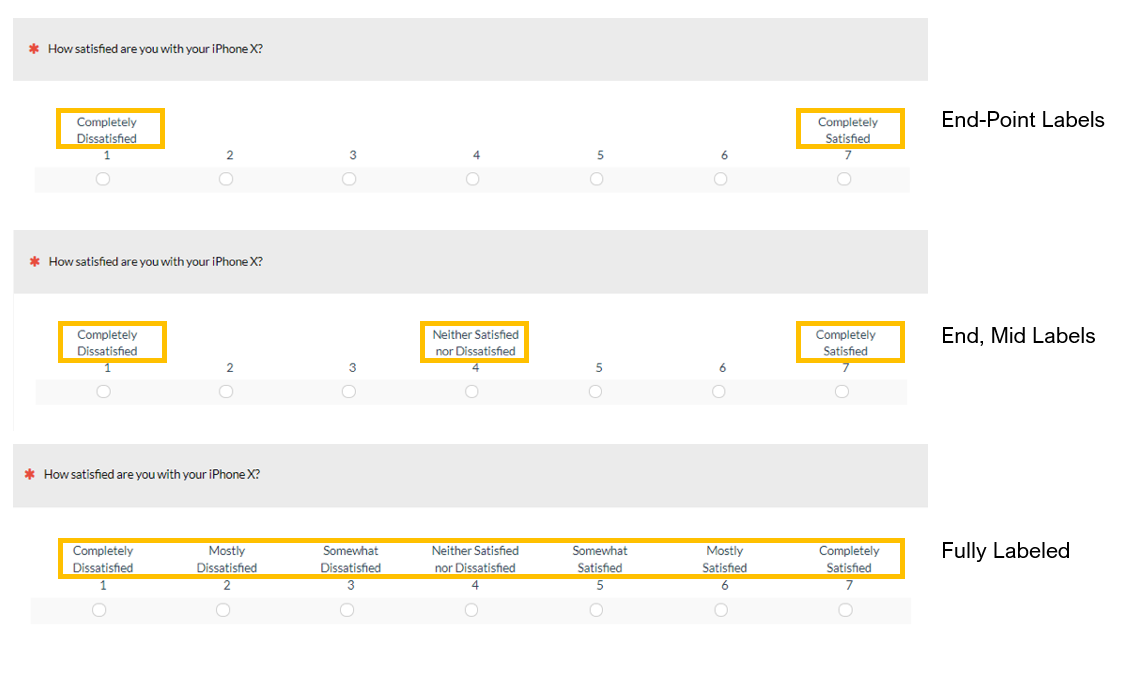
7. It’s not necessary to always label all points. What does a 5 mean on a seven-point disagree-to-agree scale if it’s not labeled? Will a scale be more reliable and valid if you always label every point? We reviewed 17 published studies and found little evidence for the clear superiority of labeling. Where labeling did matter was when the rating scale had objective meanings, such as the frequency of use of a product (daily, weekly, monthly), or it was used as a scoring rubric as in a clinical setting. We conducted our own studies with 415 respondents using rating scales common in UX research and compared full labeling to partial labeling (mid-point or just endpoints) as shown in Figure 6.
Figure 6: Examples of different approaches to labeling response options.
We found no statistical differences and no clear pattern between the mean scores on all three conditions using both five- and seven-point scales.
When assessing subjective concepts such as agreement, satisfaction, or ease, fully labeling will likely have little difference. Consider fully labeling a scale if it’s used to make a judgment (e.g., about the efficacy of a drug) or when used to assess objective criteria such as frequency of use.
8. Cultural/regional differences can affect response patterns. Many organizations need to measure internationally; are these cross-country comparisons problematic? Our review of the literature found that Asian respondents tend to avoid top-box responses and prefer neutral responses. We replicated this finding with our own study that compared responses from four countries: U.S., Japan, France, and Germany. We found Japanese respondents selected the most favorable response significantly less than US respondents did on multiple items (Figure 7).
Figure 7: Top box (most favorable response) for each scale compared by country.
When making cross-country comparisons, consider using different normed groups to account for different “average” scores by country.
Summary
Examining the published literature and our own studies across a number of aspects of rating scale formats and use, we found the following:
Points: More is generally better but with diminishing returns.
Use more than three response options to capture intensity.
The neutral point is fine for UX (aggregated and compared).
The neutral point might affect response distributions when questions are sensitive.
Labels: Matters little for subjective sentiment, but there is a benefit in labeling objective labels and rubrics.
Labeling the neutral point may attract non-customers or weak attitudes but the effect is small.
Item tone: Stay positive unless measuring a negative concept.
Cultural effects are real: Be careful when comparing countries without having developed country-specific norms.


