 If you know even just a little about statistics, you know that the value .05 is special.
When the p-value obtained from conducting a statistical test falls below .05, it typically gets a special designation we call statistically significant. This is the conventional threshold for publishing findings in academic journals, and consequently, it is ascribed especial importance. It’s a signifier that something important or noteworthy might have been found.
But what’s so special about .05? Are results only noteworthy, and only significant in the statistical sense, if p < .05? First, a quick reminder on where that p-value comes from.
P-Values in Hypothesis Testing
When conducting null hypothesis statistical testing (NHST), there are two ways to be right and two ways to be wrong. The two ways to be right are
- Deciding there’s a difference when there really is (correctly rejecting the null hypothesis, Ho).
- Deciding there is no difference when there really isn’t (correctly failing to reject the null hypothesis).
The two ways to be wrong are
- Deciding there is a difference when there really isn’t (false positive, Type I error). This error rate is called alpha and is typically set to .05.
- Deciding there isn’t a difference when there really is (false negative, Type II error). This error rate is called beta and is typically set to .20.
Figure 1 illustrates these decision outcomes.
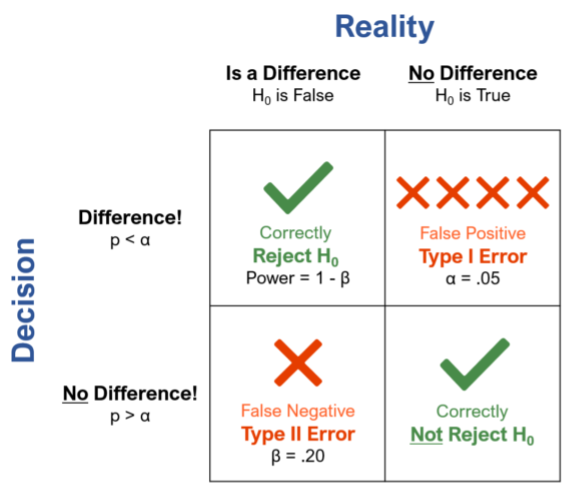
Figure 1: The four possible outcomes of NHST with conventional alpha and beta criteria.
When conducting a statistical test, you obtain a p-value. If the p-value is less than .05, the result is, by definition, statistically significant (yeah!); all other results are not statistically significant (darn!). Given this error rate of .05, over the long run, you expect to make a Type I error once out of every 20 tests (1/20 = .05).
That’s the convention, but should the alpha error rate always be set to .05?
Where Did the .05 Come From?
Although formal statistical hypothesis testing wasn’t developed until the early 20th century, there are examples of researchers using data to test hypotheses as far back as the early 18th century. In 1710, John Arbuthnot published An Argument for Divine Providence, Taken from the Constant Regularity Observ’d in the Births of Both Sexes (Figure 2) in which he reported from local christening records that more males than females were born each year in the 82 years from 1629 to 1710.
Using an early version of a binomial test, he found the likelihood of this happening by chance was near zero (p = 0.0000000000000000000000002). Arbuthnot didn’t set an explicit value for alpha, but “he appears to have been the first person to assess observed data, chance, and alternative hypotheses using a statistical test” (Cowles, 1989, p. 47).

Figure 2: First page of Arbuthnot (1710).
In the late 19th century, Francis Edgeworth, one of the first statisticians to routinely conduct tests of significance, used a very conservative alpha criterion of .005 (Stigler, 1999). The first formal statement of judging significance with p < .05 is attributed to R. A. Fisher in the early 20th century, although there is evidence that it had been conventional for some time (Cowles, 1989). An early publication by Fisher, making p < .05 explicit, is one of the soap operas of statistical history.
When Karl Pearson (for whom the product-moment correlation is named) was the grand old man of statistics, he was apparently threatened by newcomer Ronald Fisher’s ideas and mathematical ability. Pearson used his influence to prevent Fisher from publishing in the major statistical journals of the time, Biometrika and the Journal of the Royal Statistical Society. Consequently, Fisher published his work in a variety of other venues such as agricultural and meteorological journals. Included in these works were several papers for the Proceedings of the Society of Psychical Research.
An early statement recommending .05 as the criterion for statistical significance appears in the Proceedings of the Society of Psychical Research (Fisher, 1929, “The Statistical Method in Psychical Research,” p. 191). Fisher characterized this recommendation, however, as arbitrary but convenient. Notably, in the same paragraph, he mentioned the importance of reproducibility when encountering an unexpected significant result (Figure 3, one of the reasons that MeasuringU® makes significant investment in replicating previously reported research).
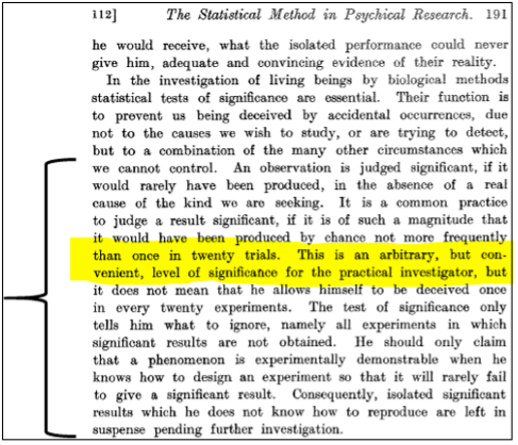
Figure 3: Paragraph from Fisher (1929) recommending .05 as an “arbitrary, but convenient” practice.
When Is It Appropriate to Set Alpha to .05?
For most researchers, setting alpha to .05 is an appropriate default to control the risk of making a Type I error (false positive). If you use this conventional value, you probably won’t be asked to justify it. Most scientific journals have adopted this value, so if your goal is to publish research, you cannot claim statistical significance without meeting this criterion.
The rationale in scientific publishing for setting alpha to .05 is that it’s generally less damaging to commit a Type II error (delaying the introduction of a real effect into the scientific literature due to low power) than to commit a Type I error (introducing false findings into scientific discourse). There is also a tacit reliance on the scientific practice of replication to catch errors, though there is some concern that the social and financial reward systems in place in academic research tend to discourage investment in replication.
When Is It Appropriate to Set Alpha to Something Other than .05?
There is, however, nothing magical about .05. In industrial research, it’s common to set alpha to .10. As Rosnow and Rosenthal (1989, p. 1277) wrote, “Surely, God loves the .06 nearly as much as the .05.” Historically, alpha gets a lot of attention, but it’s only half the story.
The history of setting alpha to .05 shows that it’s a century-old convention that has some empirical basis, but it is still just a convention, not a law of nature. One problem with the narrow focus on only the Type I error is that it takes attention away from the Type II error, emphasizing confidence over power. This is one of the reasons that industrial researchers, uninterested in publication, often set alpha to .10.
In some UX research contexts, it might be appropriate to set alpha to .05, but only if it results in an acceptable balance between Type I and Type II errors. In other UX research contexts, however, Type II errors might be more damaging than Type I errors, which would suggest a different strategy for balancing the two types of error. This is especially the case when constrainted research logistics, such as needing to conduct research with small sample sizes, increases the risk of a Type II error.
Suppose you’ve conducted a usability study of two systems (one old, the other new), with the null hypothesis being that the new system is no different from the old. Using an example from Wickens (1998), if you make a Type I error using, for example, alpha set to .10, the likely decision will be to adopt the new system when it’s no better than the old (but very likely no worse). If you make a Type II error, the likely decision will be to keep the old system when the new one may be better. As shown in Figure 4, this conclusion led Wickens to recommend setting alpha higher than .05 in this research context—at least equal to beta and, depending on the relative consequences of the two types of errors, maybe even greater than beta.
Alternatively, there may be research settings in which the occurrence of a Type I error would be devastating relative to the occurrence of a Type II error (e.g., assessment of medical treatments). In those cases, it would be prudent to set alpha to a much lower value than .05 (some have recommended using .005 in those situations).
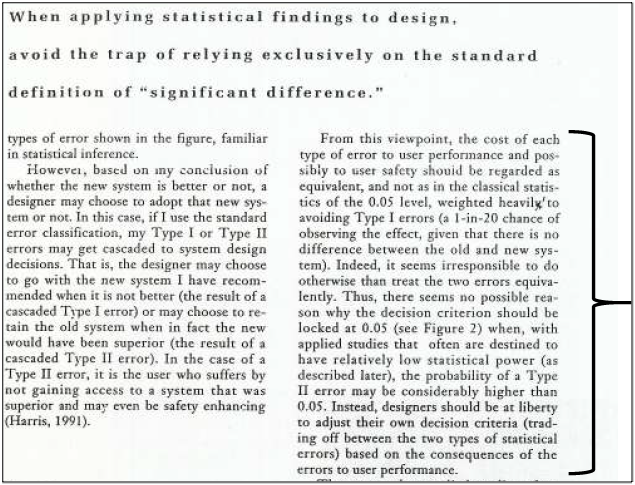
Figure 4: Conclusion from Wickens (1998) supporting alpha > .05 in some types of UX research.
Summary and Discussion
There is nothing wrong with setting alpha to .05 when it’s appropriate for the research context (e.g., publication in scientific journals).
Most researchers learn in their statistics courses to set alpha to .05. Such courses train people to publish, but this convention isn’t appropriate in all research contexts.
In industrial research (where there is no intention of publishing in journals), it’s common to set alpha to .10 as one way of increasing the power of the analyses (reducing the likelihood of Type II errors by increasing the likelihood of Type I errors). This is especially common when research logistics limit the sample size of the study.
Unless you’re planning to submit your results to an academic journal for publication, don’t worry excessively about trying to control your Type I error to .05. The goal of statistics isn’t to make the correct decision every time—that isn’t possible. The purpose of using statistics is to help you make better decisions in the long run. In an industrial setting, that could well mean setting alpha to .10 or, in some cases, to .20. (In which case, you expect to make a Type I error in about one of every five tests in which there is no difference, but you will reduce the likelihood of making a Type II error.)
The important thing is to make these decisions before you run your tests. Spend some time thinking about the relative consequences of making Type I and Type II errors in your specific context, and carefully choose appropriate criteria for alpha and beta. Then use your analysis along with the expected standard deviation and critical difference to estimate the sample size you’ll need to achieve the statistical goals of your study. If the sample size turns out to be unfeasible, revisit your decisions about alpha, beta, and the critical difference until you find a combination that will work for you.