 Are websites and products with a better user experience more profitable? If a user has a better experience, are they more likely to reuse, repurchase, and recommend the experience to others?
While there is a strong interest in quantifying how a better user experience can impact the bottom line, there’s stubbornly little data to understand the predictive abilities of UX metrics. The first step in understanding how investments in UX will pay off is knowing the connection between UX metrics and business outcomes, such as revenue, revisits, and referrals.
There is some data establishing a link. We found that attitudes toward usability as measured using the SUS predict (are correlated with) future revenue growth in software reasonably well. This analysis was done at the product level (e.g., TurboTax, AutoCAD, Microsoft Office).
In our earlier analysis, we also found a tenuous link between UX metrics (the SUPR-Q®) and future purchasing behavior on retail websites over a two-year period. However, the sample was a relatively modest 125 participants initially and only 25 respondents at the end of the analysis period. The relationship was not statistically significant, although suggestive patterns were identified.
As we saw with our in-depth analysis of the predictive ability of the Net Promoter Score, the relationship between the NPS and business metrics varies by industry. Some industries have stronger links and others have none (in the metrics we examined). Given the variability we found between industries, we wanted to examine multiple industries and experiences to investigate the link between UX metrics and business outcomes. For this article, we examined the online grocery industry for a relationship between UX metrics and future purchase behavior. The online grocery industry has lots of opportunities for repeat and frequent customers, making it a good candidate to study the relationship between current attitudes and future behaviors. Future articles will focus on other industries.
Longitudinal Study of Grocery Shopping Behavior
Between December 2021 and January 2022, we recruited 390 existing users of eight U.S.-based online grocery shopping brands (Food Lion, H-E-B, Kroger, Meijer, Publix, Safeway, Walmart, and Whole Foods).
Participants reported using their desktop/laptop computers (this was a requirement for participation in the survey), with 65% also using mobile apps and 59% using mobile websites.
We asked the participants to use the SUPR-Q and UX-Lite® to rate the overall quality of the website user experience of the grocery service they used the most. The SUPR-Q contains measures of usability, appearance, trust, and loyalty using two future intent items: likelihood to continue using and likelihood to recommend. The UX-Lite contains two items: the same ease item used in the SUPR-Q usability score and a usefulness item (“the website’s features meet my needs”). For details, see UX and Net Promoter Benchmarks of Grocery Websites.
We then followed up with all participants in February 2022 and asked them about their purchase behavior in the past 30–60 days on the same grocery website service they had rated (if they purchased, how frequently they purchased, and how much they spent).
Study Results
We received 320 usable responses, an impressively high 82% follow-up rate. We analyzed the data first at the overall service level (8 brands) and then at the individual level (320 respondents).
Overall Service Level Analysis
Table 1 shows the correlations between UX metrics (SUPR-Q and UX-Lite scores) with three self-reported purchase metrics over the past month (purchase rates, number of purchases, and purchase amount).
| Metric | SUPR-Q Percentile | SUPR-Q Raw | UX-Lite |
|---|---|---|---|
| Purchase Rate | .166 | .272 | .220 |
| Number of Purchases | .365 | .377 | .192 |
| Purchase Amount | .330 | .448 | .313 |
Table 1: Correlations between UX and purchase metrics at the overall service level.
None of these correlations was statistically significant, but that isn’t surprising given a sample of just eight companies. Notably, all correlations were positive, consistent with the possibility that user experience has some influence on future purchase behavior (not proven by these results, but also not disproven).
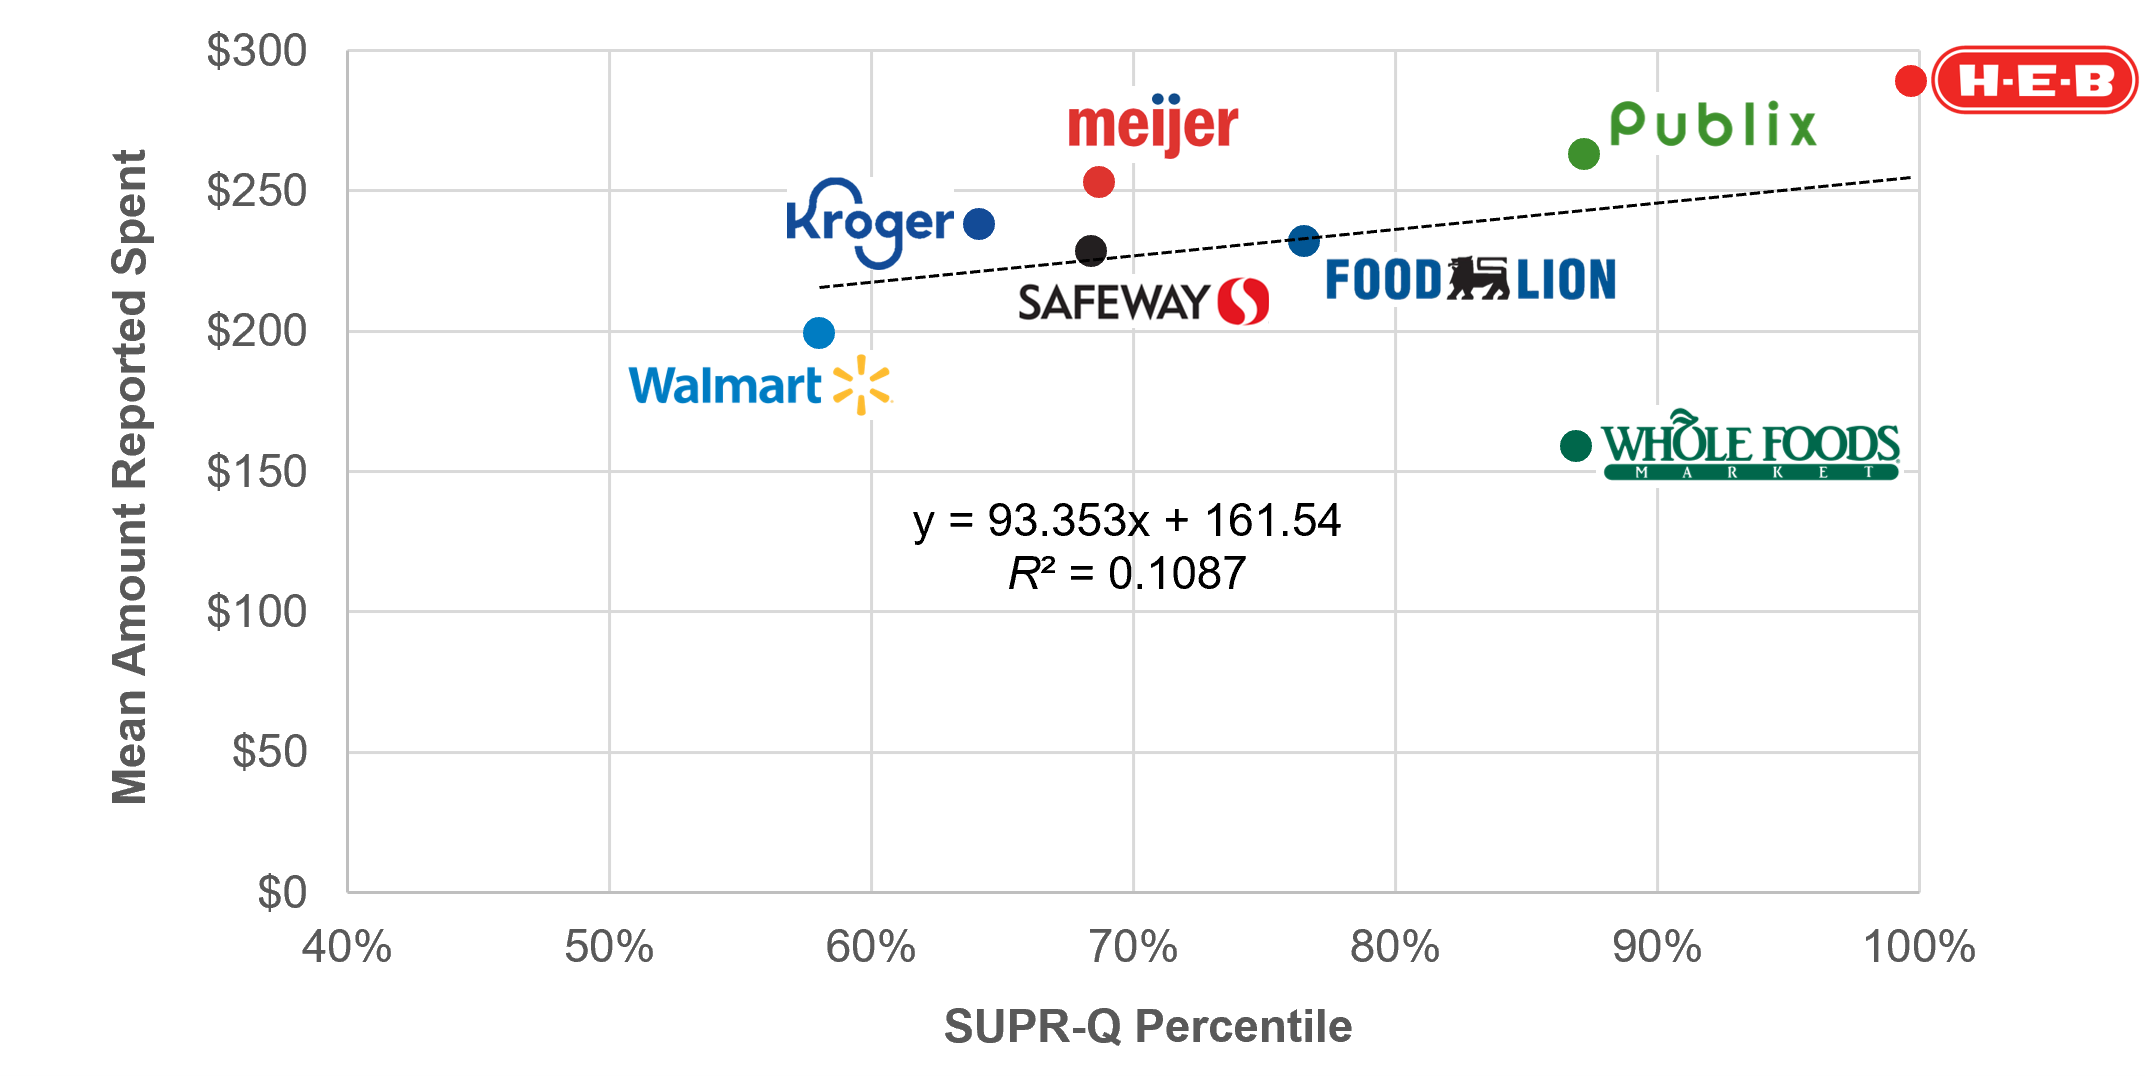
For example, consider the scatterplot for SUPR-Q Percentile and Purchase Amount shown in Figure 1. The scatterplot indicates that Whole Foods is an outlier, with one of the highest SUPR-Q percentiles and the lowest amount spent. Recalculating the correlation without Whole Foods would result in a statistically significant correlation of .89 (R2 = .79). We need to be cautious about ignoring data when there is such a small sample size (avoiding cherry-picking the data we like), but this shows how one outlier in the analysis of a fairly small number of services can dramatically reduce estimates of linear correlation. An outcome like this raises questions for future research on the apparently unique UX/purchasing pattern for Whole Foods.
Individual Level Analysis
Correlations
As shown in Table 2, the correlations at the individual level (one person’s attitudinal data and their reported purchases) were, as expected, smaller than at the service level due to higher individual variability. On the other hand, the sample size at the individual level was greater (n = 320), so smaller correlations can be identified as statistically significant. For the SUPR-Q, Table 2 shows relationships with SUPR-Q mean scores because SUPR-Q percentile scores are only meaningful at the service (website) level.
| Metric | SUPR-Q Raw | UX-Lite |
|---|---|---|
| Purchase Rate | .196** | .165** |
| Number of Purchases | .101 | .060 |
| Purchase Amount | .170** | .116* |
Table 2: Correlations between UX and purchase metrics at the individual level (** = p < .01; * = p < .05).
All correlations were positive and, for purchase rate and purchase amount, were statistically significant. Using Cohen’s (1988) guidelines, the significant correlations had between small (.10) and medium (.30) magnitudes.
Nonlinear Analysis
These correlations are based on linear relationships between the attitude and future reported purchase behavior. In our earlier research, however, we identified nonlinear relationships in which those with more favorable attitudes tended to purchase more than those with less favorable attitudes.
Using the same approach as our earlier analysis, we divided the SUPR-Q into four groups based on the SUPR-Q scores in our current normative database (1: 0–49th percentiles; 2: 50–74th; 3: 75–94th; 4: 95–100th); we then used these groups to analyze the purchase metrics that were significantly correlated with UX metrics.
Purchase Rate
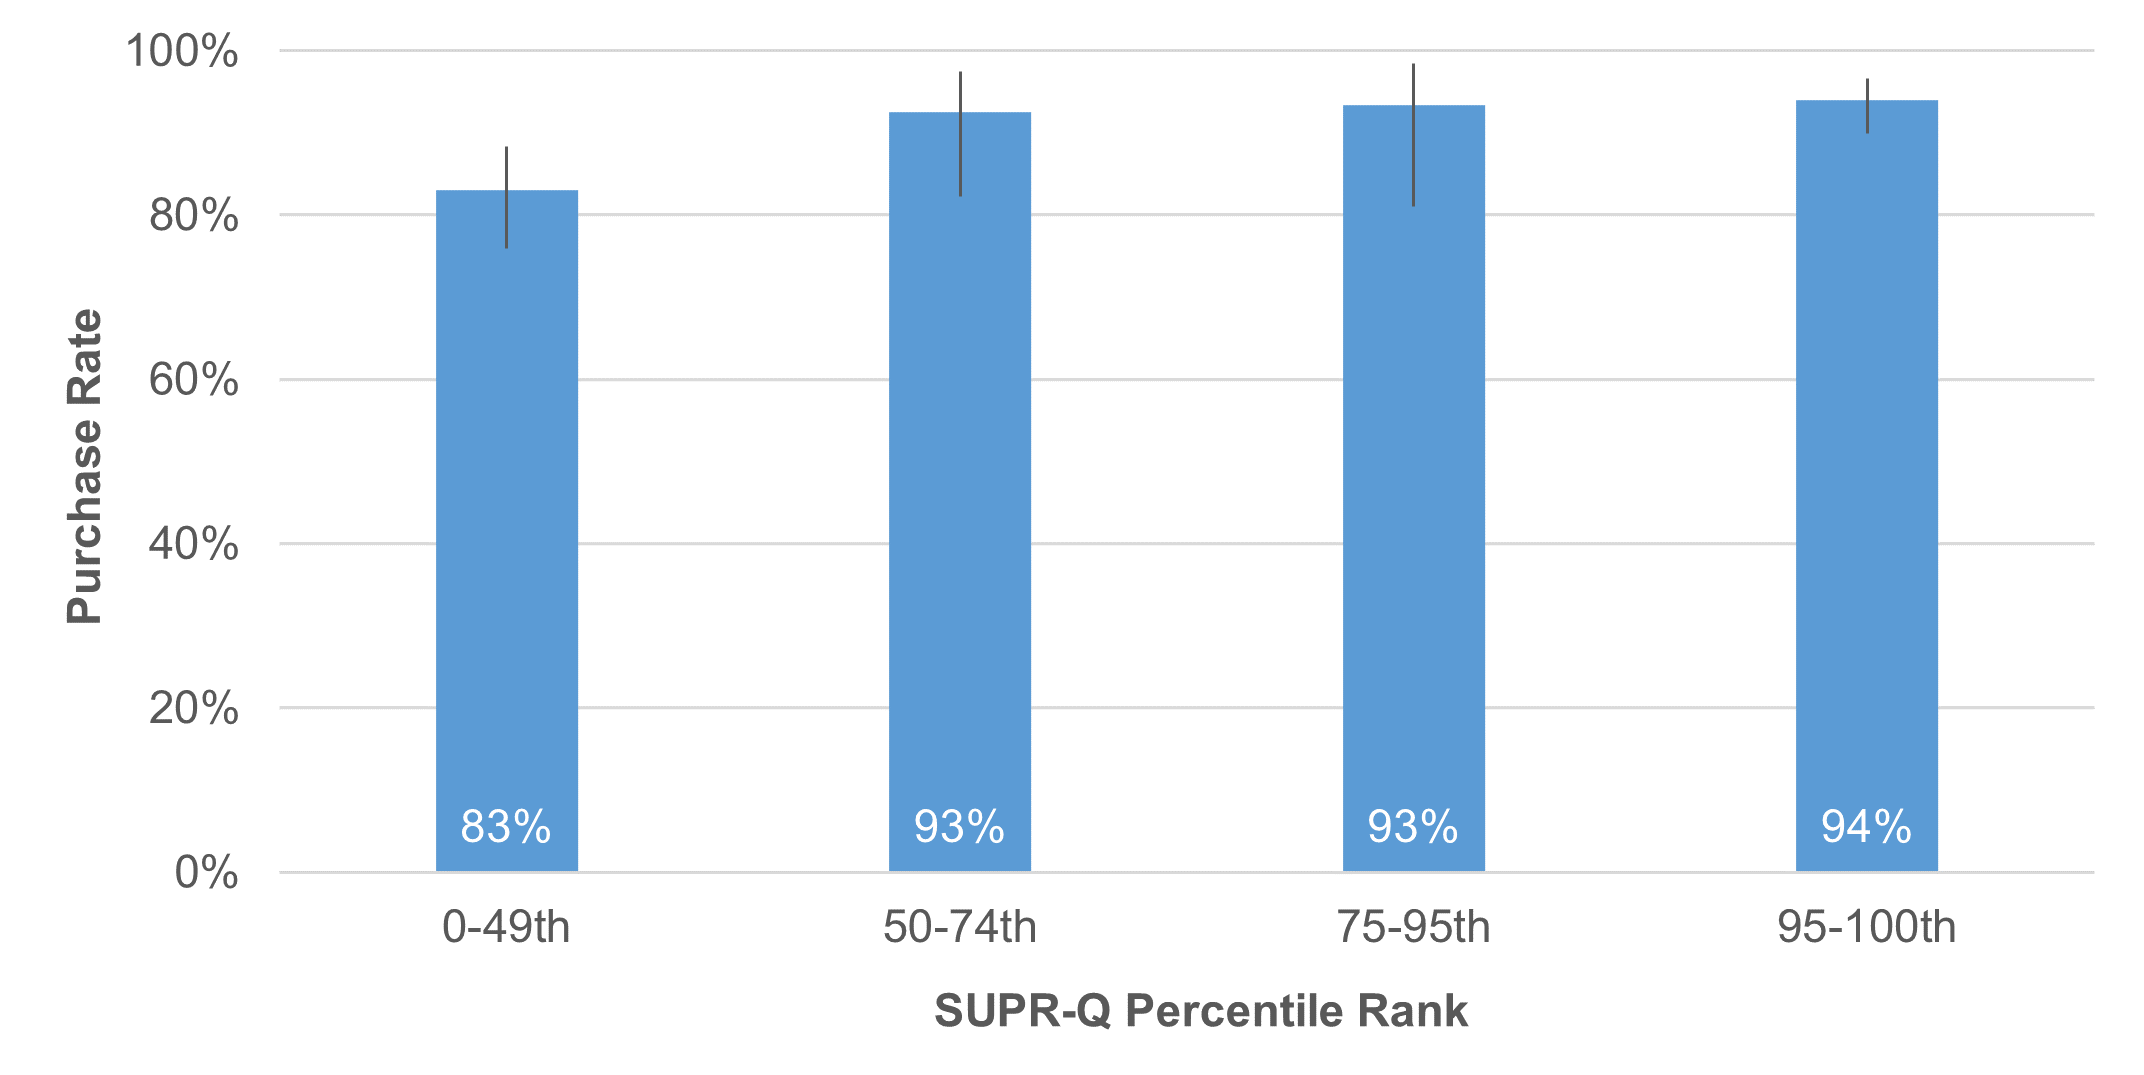
As shown in Figure 2, there was a significant difference in purchase rates for participants reporting the poorest experiences (0–49th percentiles [below average]: p = .003 after collapsing the top three groups to 50–100th percentiles). When experiences were average (50–74th), above average (75–94th), and well above average (95–100th), the purchase rates were 93–94% versus 83% for below average (0–49th).
With only two five-point items, the UX-Lite has less opportunity for discrimination at the individual level, so we were only able to divide the sample into two groups (1: 0–49th percentiles; 2: 50–100th). Despite this, based on our current normative database for UX-Lite scores, comparison of purchase rates for participants who provided UX-Lite scores that were below average (purchase rate of 86.5%) with those who had average or above-average scores (purchase rate of 93.6%) were significantly different (p = .03).
Purchase Amount
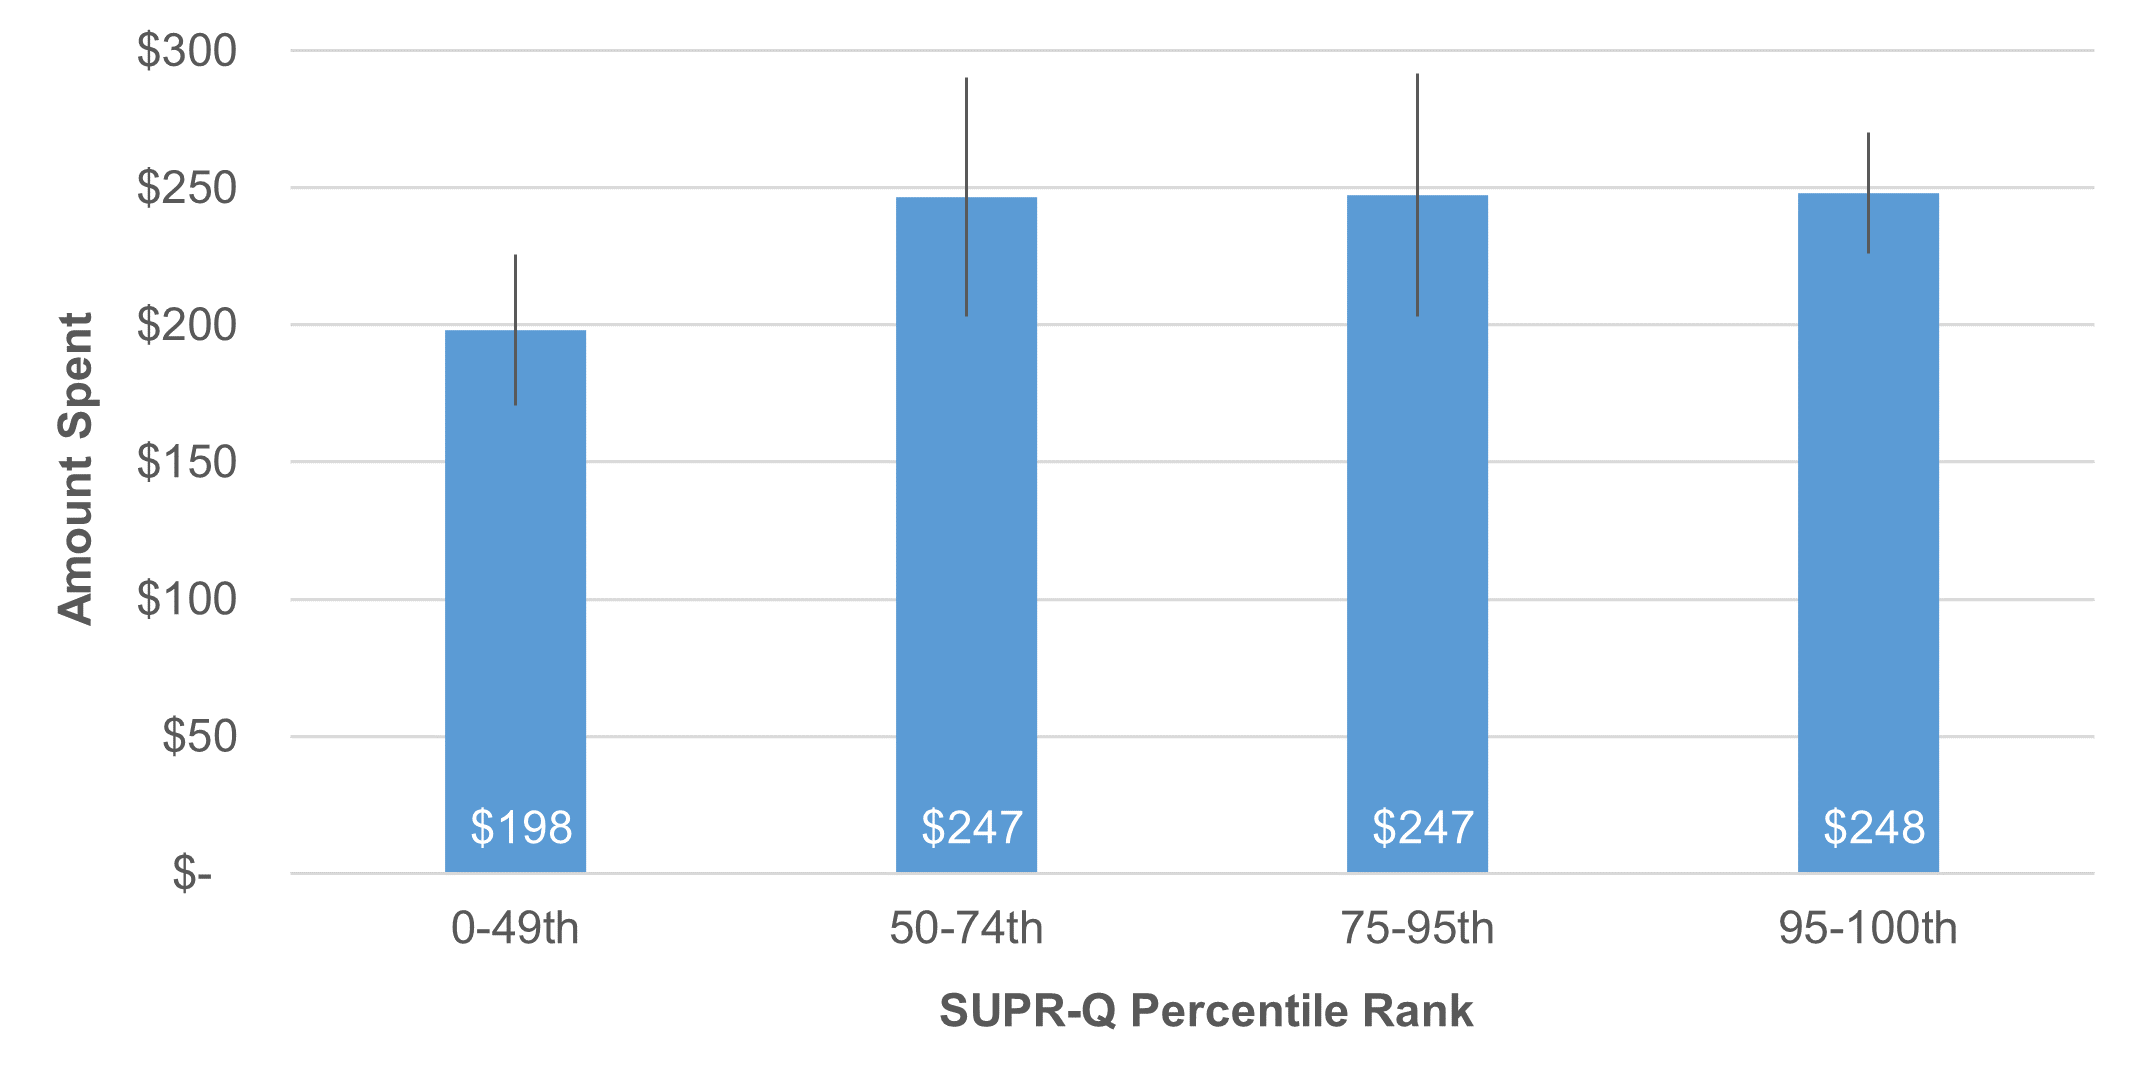
Figure 3 shows the amount spent by SUPR-Q percentile rank. The results mirrored those for the purchase rate. Participants with below-average experiences reported spending significantly less than those who had average to above-average experiences (a drop of about 20%, from almost $250/month to about $200, p = .01 after collapsing the top three groups to 50–100th percentiles). The difference in purchase amount for the UX-Lite groups (estimated to be about $20/month less when UX-Lite scores were below average) was not statistically significant.
Summary and Discussion
A longitudinal analysis of 320 users of eight online grocery services found that
UX attitudes predicted future purchase behavior. Both the SUPR-Q and UX-Lite had positive correlations with future purchase rates and amounts. The relationships were seen at both the service level and the individual level.
The relationship was nonlinear. As we saw in similar earlier analyses, there was a nonlinear relationship between UX metrics and future reported behavior. This suggests the correlation coefficients are likely to understate the strength of the relationships.
Range restriction may have attenuated correlation. Another characteristic of the data is that the UX metrics tended to be high. These generally high ratings led to a restricted range that can artificially reduce the magnitudes of correlations.
Poor UX scores predicted fewer purchases and fewer dollars spent. As we’ve seen with other attitude/behavioral connections, user experiences affected spending behavior. Specifically, participants who reported a poor experience (0–49th percentiles, below average) had significantly lower purchase rates and amounts than those with average or above-average experiences.
The research method has some limitations. We relied on self-reported purchase rates from people who used online grocery shopping services. It’s possible that people who have more favorable attitudes toward a brand may overstate purchases to some unknown degree. However, our earlier analysis found that self-reported purchase rates were relatively accurate when compared to verified purchase rates.
Other predictive variables may also play a role in predicting shopping behavior. In a future article, we’ll look at the relationships between behavioral intentions (e.g., likelihood to recommend) and behavioral outcomes (e.g., recommendation rates and shopping behaviors).
Key takeaway: Commercial enterprises need to provide user experiences that are at least average or pay the price. Poor user experiences with these online grocery shopping services relative to average to above-average experiences led to a drop in shopping rates from 94% to 83% and a roughly $50/month drop in spending.
Thanks to Katherine Lee, PhD for helping with the data collection and analysis.