 For publicly traded companies, it’s not enough to be profitable—you must grow your profits. And growth is often driven by acquiring new customers while retaining existing ones.
Much of the allure of the Net Promoter Score is its touted ability to be a leading indicator of growth or a harbinger of receding growth. This is done by measuring people’s intention to recommend companies and using that likelihood-to-recommend rating to classify them as promoters, passives, or detractors. Word of mouth is a powerful driver of purchasing behavior. How people pick a realtor, an accountant, or a movie to watch is often influenced by recommendations from friends and colleagues.
But one of the early criticisms of the validation of the Net Promoter Score’s ability to predict company growth was that its author, Fred Reichheld, correlated NPS data with historical data and not future growth data. Since then, we have replicated some of his findings and found at least modest future predictive abilities of the NPS in 11 out of 14 industries (average correlation of .35).
In our analysis of the published NPS literature, we found a dearth of data at the individual level—that is, few researchers were tracking recommendations and following up with the same people (a longitudinal analysis). We needed a longitudinal dataset—one that had individual attitudinal and behavioral intention data that preceded individual behavioral data.
To measure the predictive validity of the likelihood-to-recommend (LTR) item and the Net Promoter Score (NPS), we analyzed data collected over a two-month period in the online grocery industry in the U.S.
Longitudinal Study of Online Grocery Shopping Behavior
Between December 2021 and January 2022, we recruited 390 existing users of eight U.S.-based online grocery shopping brands (Food Lion, HEB, Kroger, Meijer, Publix, Safeway, Walmart, and Whole Foods).
We asked participants to rate the overall quality of the user experience of the online grocery service they used the most with the SUPR-Q® and UX-Lite® (see “UX and Net Promoter Benchmarks of Grocery Websites” for analytical details and results). Participants also completed the eleven-point LTR item used to compute the NPS (Figure 1).

We then followed up with all participants approximately 30–60 days later (February 2022). We asked whether they had recommended the service they previously rated to anyone in the last month and their purchase behavior with the service in the last month (whether they purchased, how frequently, and how much).
Study Results
We received a total of 320 usable responses for the follow-up study, an impressively high 82% follow-up rate. In addition to its simplicity, the NPS is popular due to the expectation that a higher LTR should be positively correlated with actual recommendations.
LTR and NPS Prediction of Future Recommendations
We analyzed the LTR and NPS relationships with reported follow-up recommendations, first at the overall service level (eight brands) and then at the individual level (320 respondents).
Overall Service Level Analysis
With only eight services, our analysis options are limited to correlation. Only very large correlations (greater than .708) would pass the standard criterion for statistical significance (p < .05). At the service level, we’re looking for broad indicators consistent with positive relationships between the LTR and NPS with reported recommendation rates.
As expected, because NPS is derived from LTR, the correlation between LTR and NPS was very high (r = .95, p < .01). Because the correlation between LTR and NPS was so high, we expected little practical difference between their correlations with other metrics.
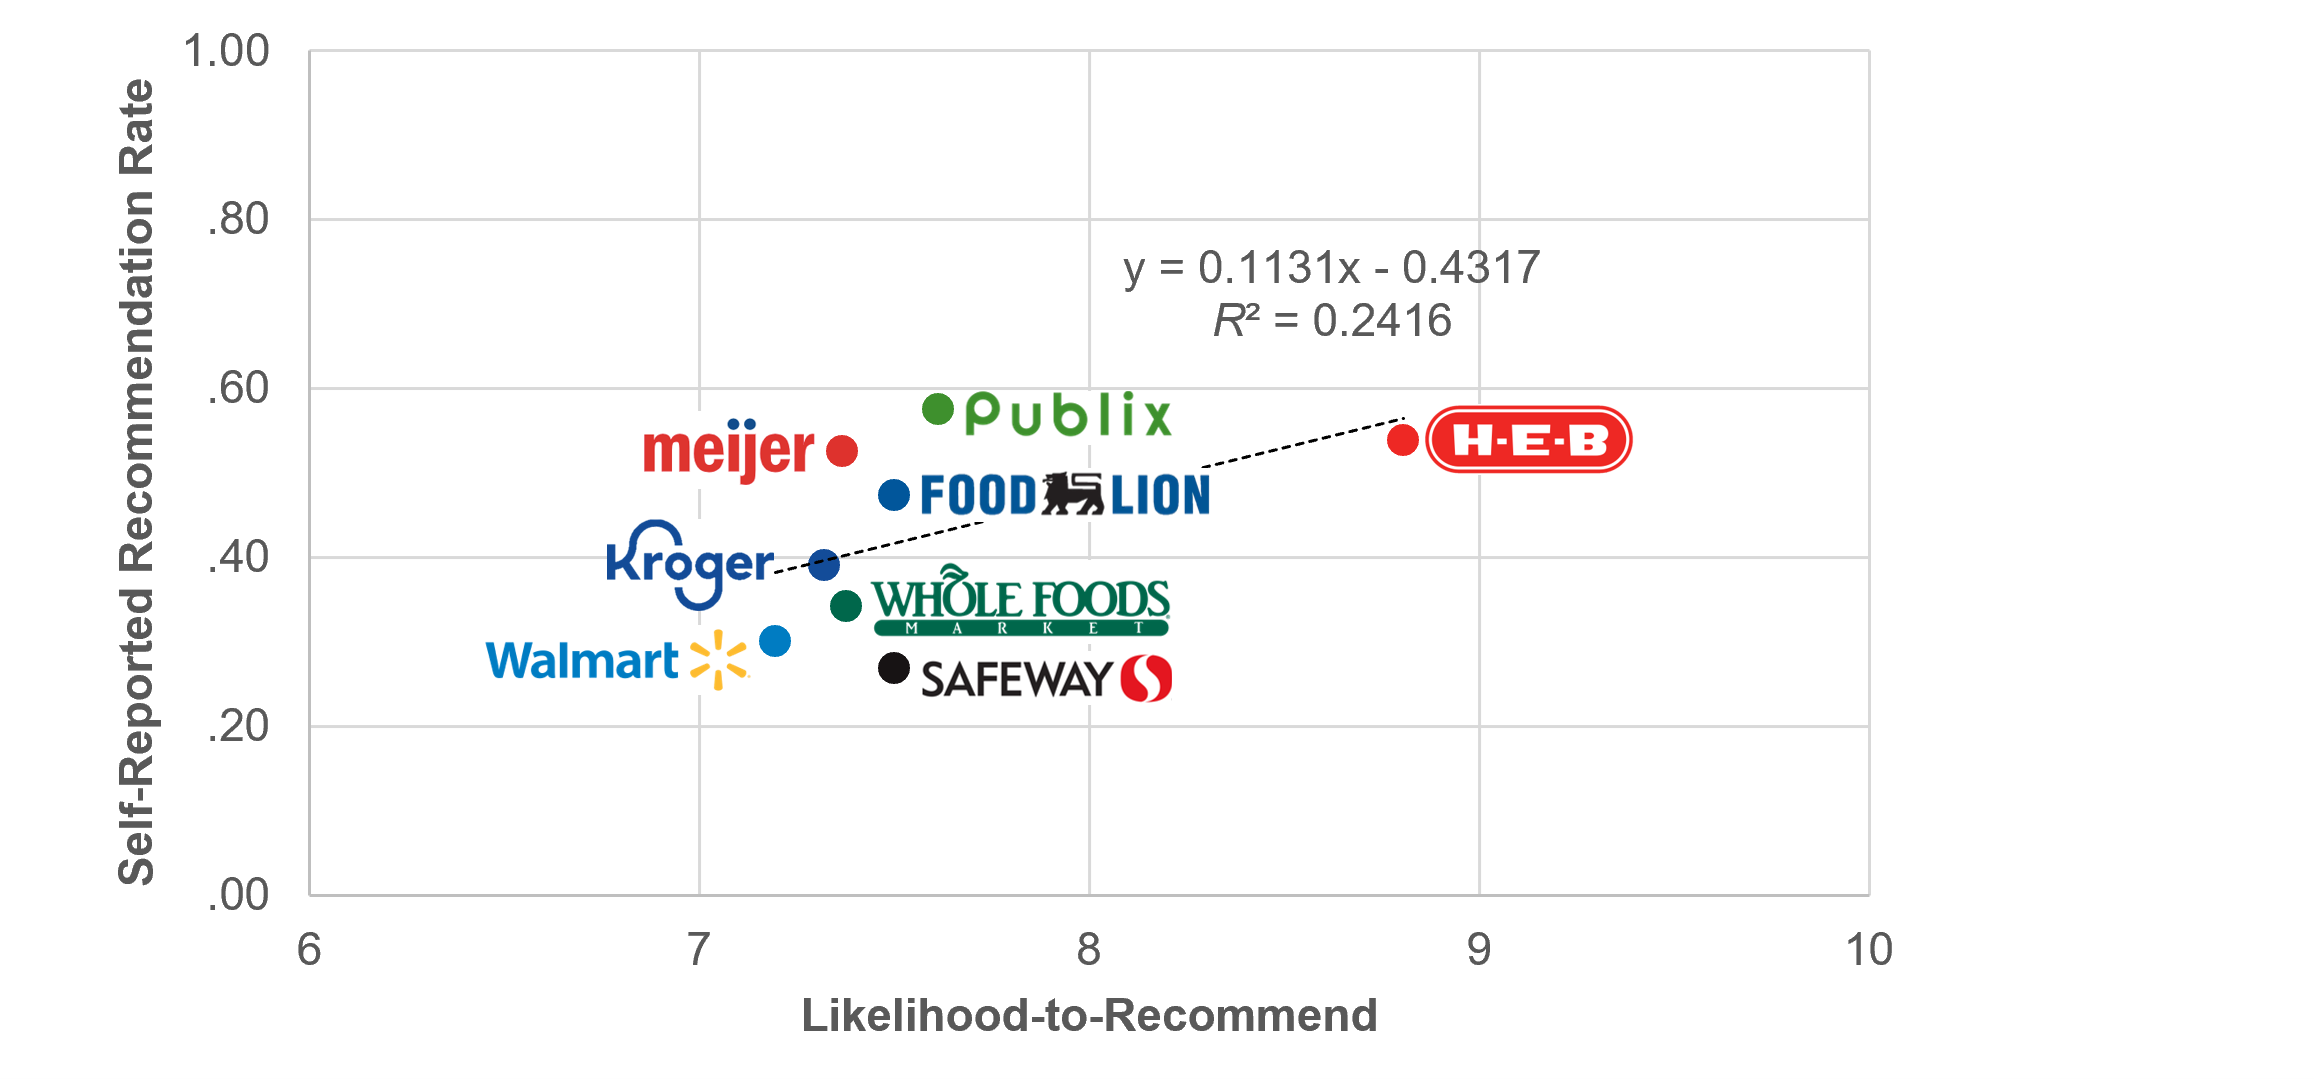
The correlations between LTR and NPS with self-reported recommendations over the past month were, respectively, .491 and .327, neither of which was statistically significant, but both of which were positive, so trending in the hypothesized direction. Figure 2 shows the scatterplot for LTR by reported recommendation rates.
Individual Level Analysis
Relative to analysis at the service level, we expected correlations at the individual level to be lower (because there’s less variability when data are aggregated), but because the sample size is much larger (n = 320), statistical significance of relationships can be established with smaller correlations (e.g., when r = .092, p = .10; when r = .11, p = .05; when r = .144, p = .01). At the individual level, we can also examine nonlinear relationships by comparing recommendation percentages for each NPS category (detractors, passives, and promoters).
The correlations for LTR and NPS with self-reported recommendation rates were, respectively, .331 and .352 (both significant with p < .01). Using Cohen’s (1988) guidelines for interpreting the magnitudes of correlations (.10 is small; .30 is medium; .50 is large), the LTR/NPS correlations with recommendation rate were between medium and large.
Analysis by NPS Category
Figure 3 shows that over half of promoters (58%) reported having recommended the grocery service to someone in the last month—just over four times the recommendation rate of detractors (14%).

As we saw in an earlier analysis of recommendation behavior, not all promoters recommend, but promoters dominate the recommendations. Across all NPS categories, around 44% of participants reported recommending. Promoters accounted for the majority (58%) of all recommendations. This is consistent with our earlier finding that between 51% and 77% of all recommendations come from promoters.
LTR and NPS Prediction of Reported Future Purchase Behavior
The results in the previous section demonstrate a significant relationship between likelihood-to-recommend and follow-up rates of self-reported recommendation behaviors.
Because behavioral intentions are usually correlated with one another, we also investigated the relationships between LTR and NPS with three different self-reported shopping behaviors (purchase rates, number of purchases, and purchase amounts).
Overall Service Level Analysis
Table 1 shows the correlations between LTR and NPS with the three self-reported purchase metrics over the past month. As expected, the correlations for LTR were like those for NPS (same rank order in the table), with LTR slightly higher than NPS.
| Variable | LTR | NPS |
|---|---|---|
| Purchase Rate | .439 | .300 |
| Number of Purchases | .427 | .391 |
| Purchase Amount | .649 | .549 |
Table 1: Correlations between LTR/NPS and purchase metrics at the overall service level.
Consistent with the hypothesized direction, all correlations were positive. None of the correlations were significant at p < .05, but the correlation between LTR and purchase amount had p = .08, even with such a small sample.
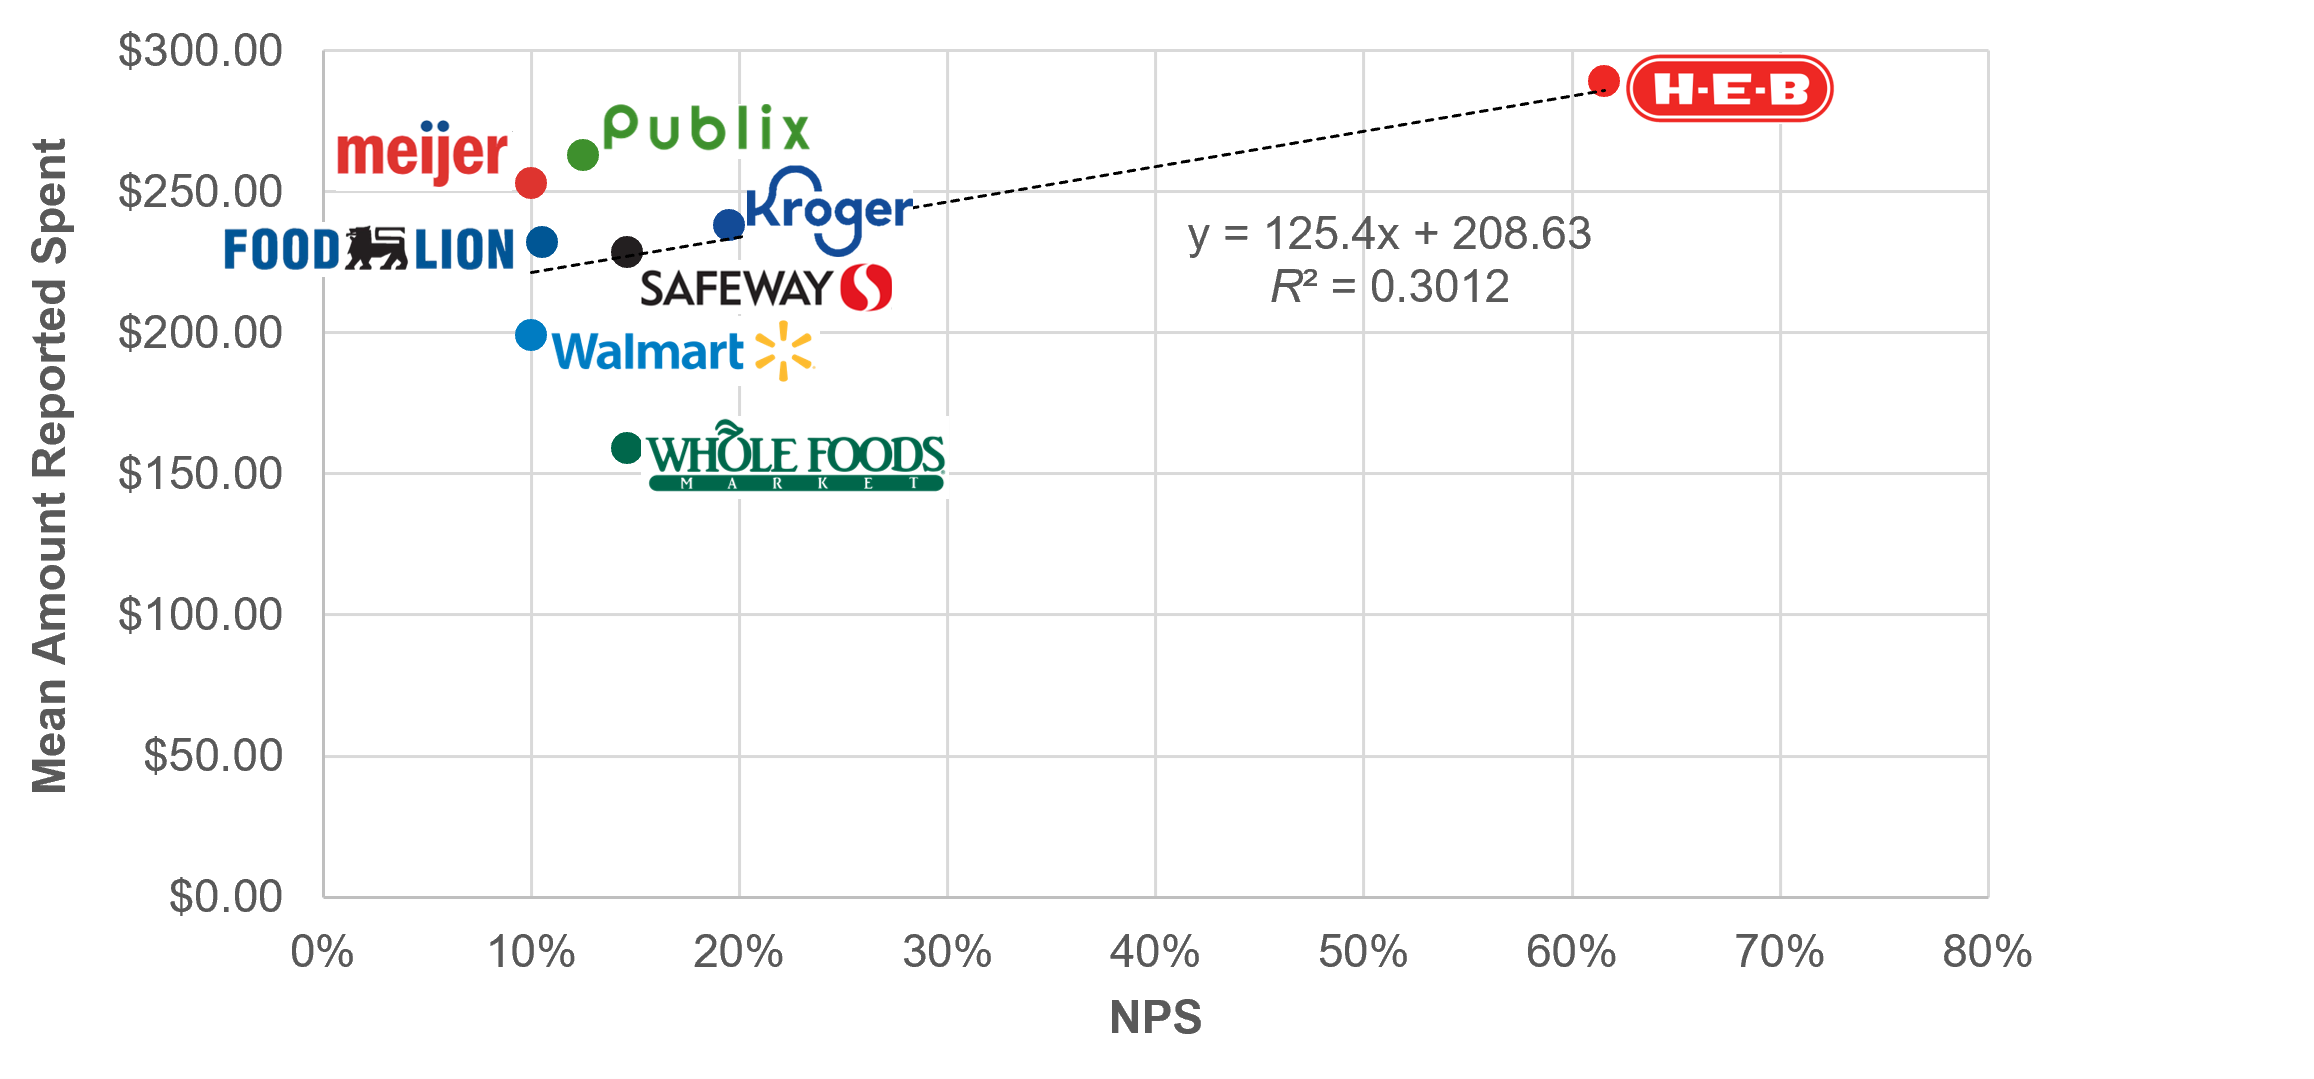
For example, consider the scatterplot for NPS and purchase amount shown in Figure 4. The scatterplot indicates that Whole Foods is an outlier with the lowest amount spent (less of an outlier than it was when analyzing these relationships with SUPR-Q data, but still an outlier). Recalculating the correlation without Whole Foods would result in a statistically significant correlation of .71 (R2 = .51, p < .05). We need to be cautious about ignoring data when there is such a small sample size (avoiding cherry-picking), but this shows how one outlier in the analysis of a fairly small number of services can reduce estimates of linear correlation. This outcome raises questions for future research on why Whole Foods customers reported lower spending than the other services.
Individual Level Analysis
Table 2 shows the correlations between LTR and NPS with self-reported recommendation rates and three self-reported purchase metrics over the past month (purchase rates, number of purchases, and purchase amount).
| Variable | LTR | NPS |
|---|---|---|
| Purchase Rate | .152 | .153 |
| Number of Purchases | .205 | .208 |
| Purchase Amount | .239 | .243 |
Table 2: Correlations between LTR/NPS and purchase metrics at the individual level (all p < .01).
All correlations were positive and significant (p < .01). Using Cohen’s (1988) guidelines for interpreting the magnitudes of correlations (.10 is small; .30 is medium; .50 is large), the LTR/NPS correlations with purchase behaviors were between small and medium.
Analyses by NPS Category
Purchase rate
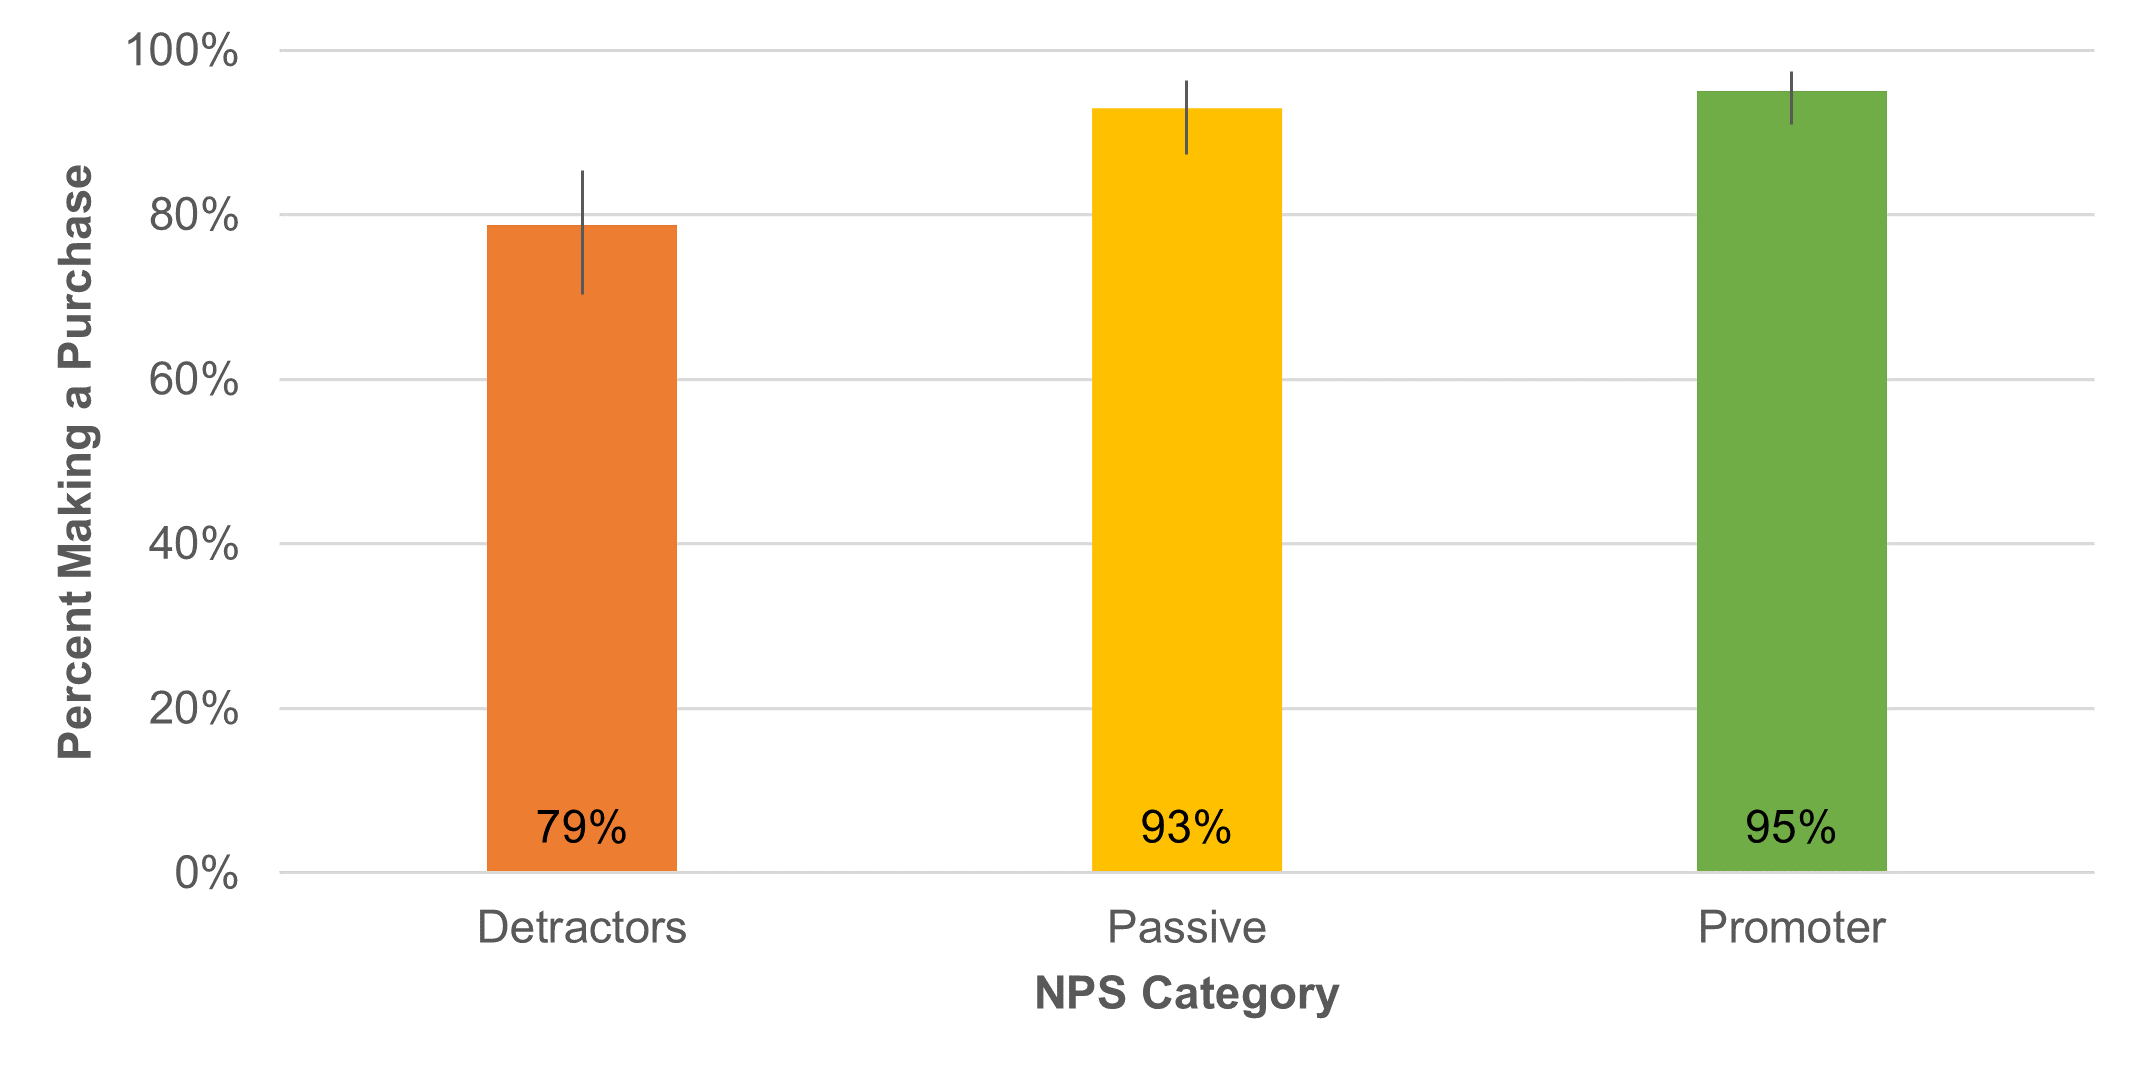
Figure 5 shows the purchase rate for promoters (95%) was statistically higher than for detractors (79%) (p <.01 using an N-1 Two-Proportion test). All groups were likely to report making a purchase, but the purchase rate for promoters was 16 percentage points higher, a relative increase of 21%.
Number of purchases
Figure 6 shows promoters reported making significantly more purchases than detractors (3.2 vs. 2.4, an increase of 33%; F(2, 317) = 4.91, p < .01).

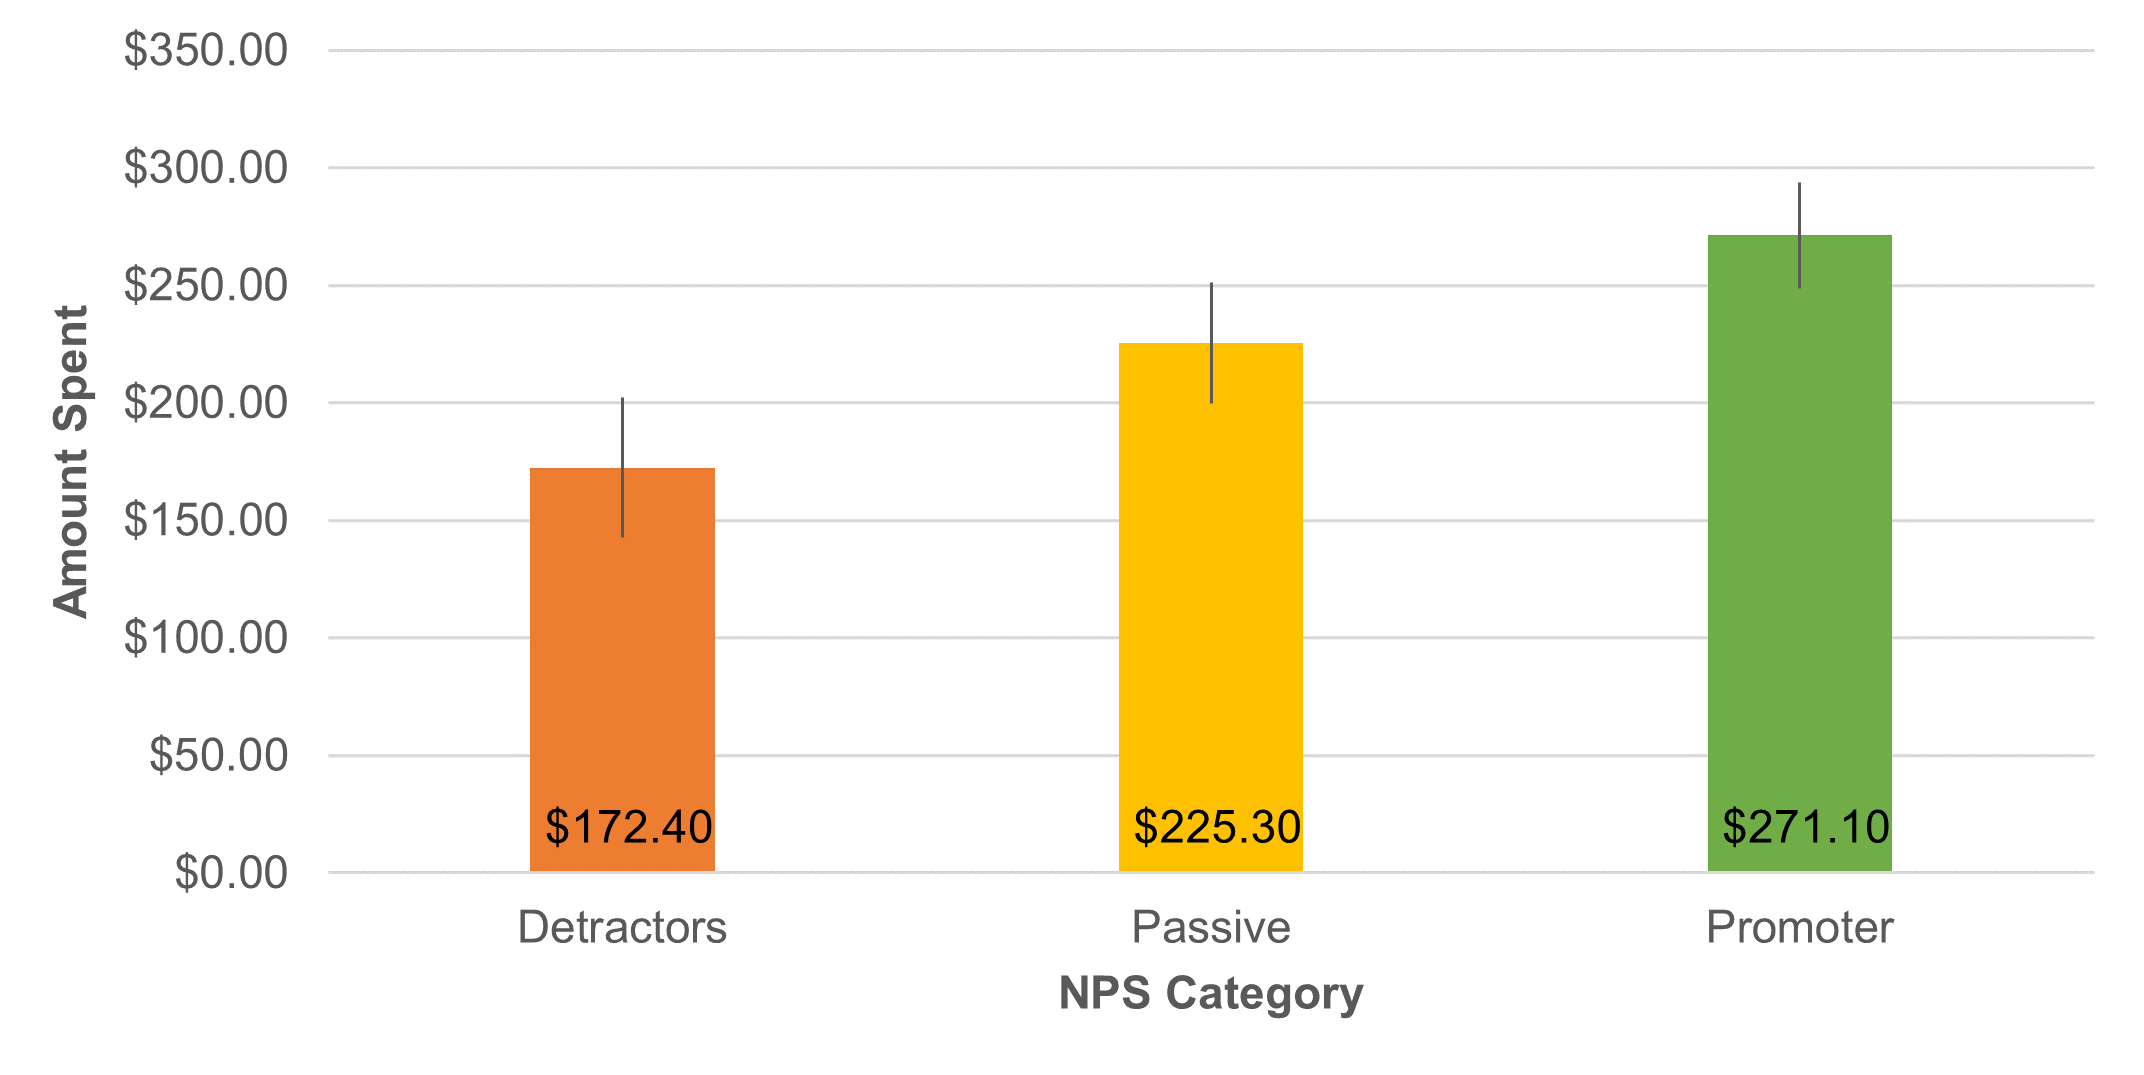
Purchase amounts
Figure 7 shows promoters estimated spending an average of $99 (57%) more than detractors and $46 (20%) more than passives. These differences were statistically significant (F(2, 317) = 9.98, p < .01).
Summary and Discussion
Here are our key findings, study limitations, and main takeaway.
Key Findings
A longitudinal analysis of 320 users of eight online grocery services found
NPS was predictive of future recommendation. Both LTR and NPS had positive correlations with future recommendation at the product level (LTR: r = .491; NPS: r = .327) and at the individual level (LTR: r = .331; NPS: r = .352).
The relationships with LTR were nonlinear. As we saw in similar earlier analyses, there was a nonlinear relationship between LTR and future reported behavior, demonstrated through analysis of those behaviors by each NPS category (detractor, passive, promoter).
Poor NPS ratings predicted fewer purchases and fewer dollars spent. The behavioral intention to recommend was also predictive of spending behavior. Specifically, detractors reported engaging in significantly lower shopping behaviors than promoters. This is consistent with our earlier findings on the same dataset using SUPR-Q scores to predict purchase behavior.
Study Limitations
Range restriction may have attenuated correlation. Another characteristic of the data is that the LTR/NPS metrics tended to be high (average NPS of 19%). These generally high NPS ratings may have led to a restricted range (which can artificially reduce the magnitudes of correlations).
We measured self-reported recommendations and purchase rates. We relied on self-reported recommendations and purchase rates from people who used online grocery shopping services. It’s possible (and likely) that people who have more favorable attitudes toward a brand may overstate their recommendations and purchases to some unknown degree. We think it’s prudent to be skeptical about the accuracy of the actual recommendation rates and actual purchase rates. While purchase rates are easier to track (e.g. with receipts), recommendations are more challenging to track. Instead, we recommend looking at the relative difference between categories (promoter versus detractor) in their ability to portend higher and lower purchase and recommendation rates.
Main Takeaway
NPS promoters are not only more likely to recommend but also to shop more frequently and spend more. Relative to detractors, promoters were four times more likely to report recommending, had a 21% higher shopping rate, reported making 33% more purchases, and estimated spending 57% more. Enterprises should strive to keep their promoters happy and, in general, avoid making any customers unhappy.