 The Mean Opinion Scale (MOS) is a standardized questionnaire used to assess synthetic speech.
The quality of synthetic speech strongly affects the user experience of working with conversational systems, with listeners making rapid and unconscious judgments of the speaker’s personality, so it’s important to have standardized methods for its assessment.
In an earlier article, we described how the MOS was originally developed to assess speech quality over degraded voice channels (such as cellular systems or other applications of speech compression). The original MOS had its first major revision in 2001 with the MOS-R (see Figure 1).
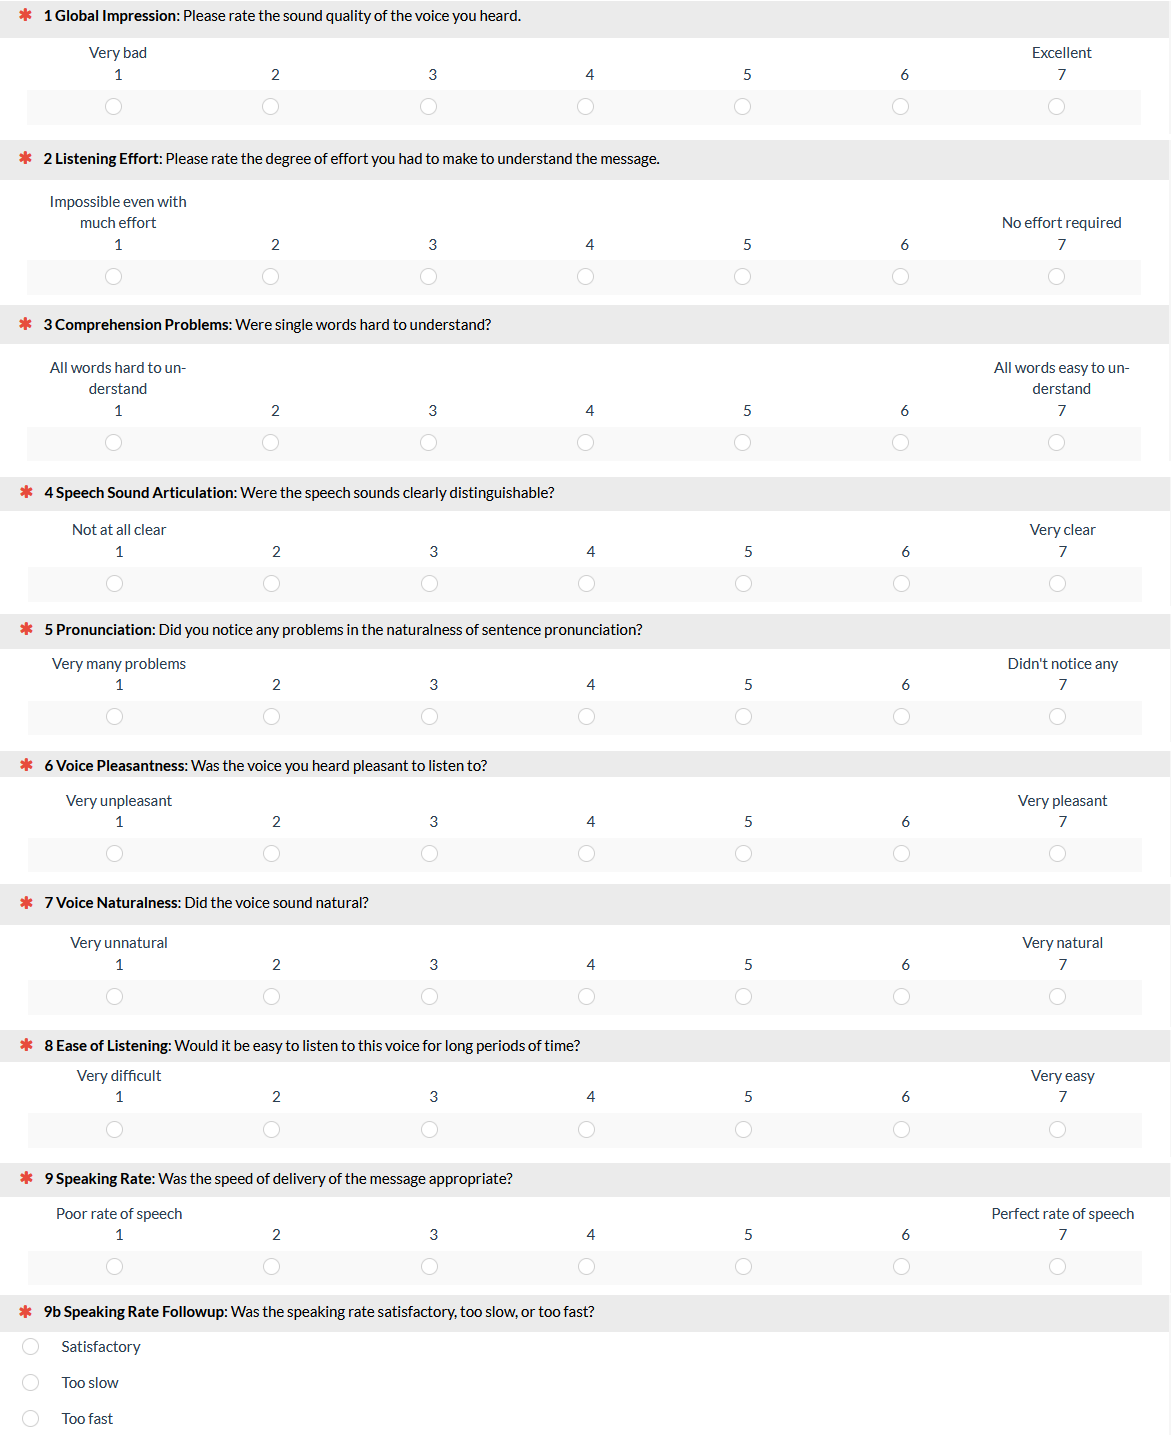
Figure 1: The Mean Opinion Scale Revised (MOS-R). It has two factors: Intelligibility (Items 2–5, 9) and Naturalness (Items 6–8).
In this article, we’ll discuss how the MOS has evolved over the last 20 years, including its most recent evolution from the MOS-X to the MOS-X2.
From the MOS-R to the MOS-X: The search for new items to measure new factors
Recognizing that the emergence of conversational speech systems required evaluation beyond the basics of intelligibility and naturalness, Polkosky and Lewis (2003) conducted a series of studies to expand the coverage of the MOS-R to include important perceptual speech characteristics and social impression. In their first study, 204 IBM employees used an expanded version to rate five synthetic voices in a between-subjects experimental design.
The initial item set included 22 items, consisting of
- The nine items from the MOS-R
- A new item (Human-Like Voice) expected to align with Naturalness
- Eight new items based on clinical evaluation of human speech characteristics: voice (Loudness, Emphasis, Voice Quality, Pitch), fluency (Interruptions, Rhythm, Intonation), and articulation (Precision)
- Four new items related to the social impression created by human voices (Topic Interest, Trust, Confidence, and Depression)
The questionnaire was sensitive to differences in the test voices, but there were some issues with its factor structure. After selecting the 15 best items, there were five factors (Intelligibility, Naturalness, Fluency, Voice, and Social Impression). Most factors had reliabilities (coefficient alpha) over .85, but the reliability of Voice was just .46. The usual criterion for research measures is a reliability of .70 or more (Nunnally, 1978), so this was unacceptably low.
In a second study, a new version of the questionnaire was created, retaining the 15 best items from the first study and adding six additional items (Monotone Quality, Attractiveness, Enthusiasm, Persuasiveness, Impatience, and Fear), for a total of 21 items. This version was evaluated using the same procedure as the first study (n = 138). Initial item analysis and factor analysis indicated four factors (Intelligibility, Naturalness, Social Impression, and Negativity). As in the first study, the results of the second study showed evidence of sensitivity to differences in the voices and acceptable reliability for the first three factors (all over .83), but the reliability of Negativity was just .65.
To increase the sample size and focus on the 14 items that were common to both of the expansion studies, those data were combined and factor analyzed (n = 342). The result was a four-factor structure in which each factor had acceptable reliability—Intelligibility (.88), Naturalness (.87), Prosody (.85), and Social Impression (.71).
The final study in this series used those 14 items as a starting point, adding two items (Enthusiasm and Persuasiveness) in an attempt to improve the reliability of Social Impression, and collected ratings from 327 participants who rated ten synthetic voices in a between-subjects design. The Depression item was dropped, leaving the 15 items shown in Figure 2. Factor analysis indicated alignment of the items with the expected four factors, all of which had reliability greater than .85 and suitable sensitivity to differences in the synthetic voices. The result of this analysis was the MOS-X.
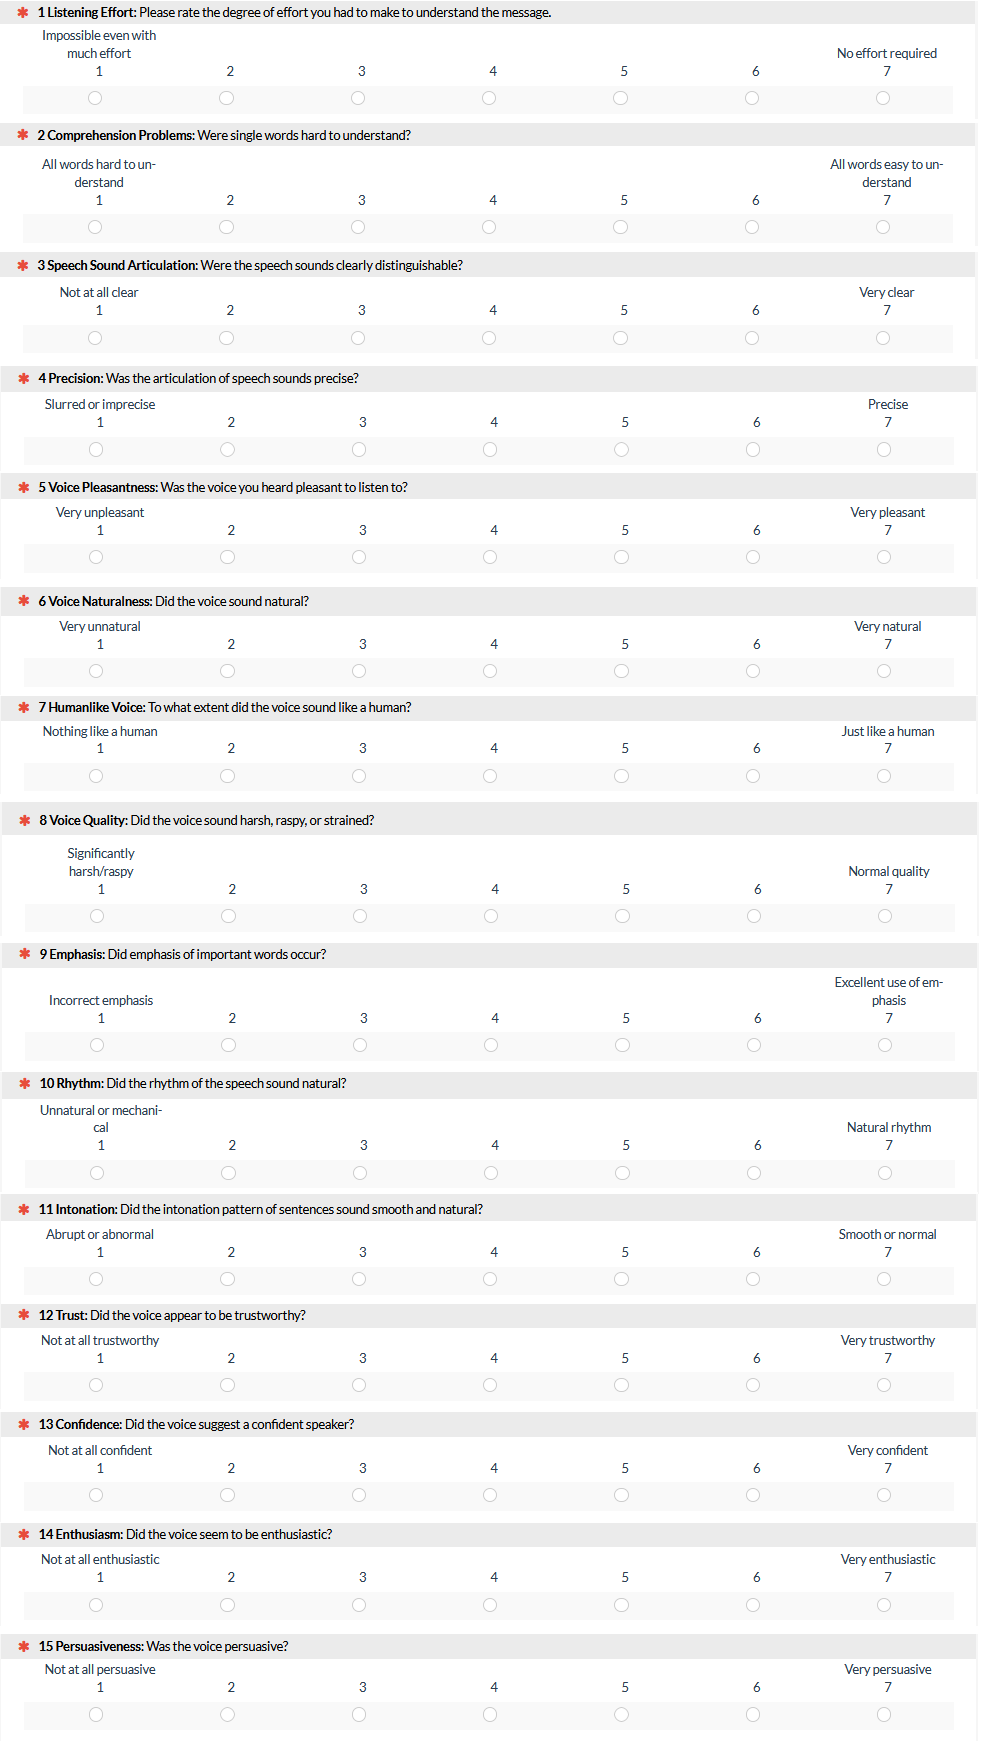
Figure 2: The Mean Opinion Scale Expanded (MOS-X), with factors of Intelligibility (Items 1–4), Naturalness (Items 5–8), Prosody (Items 9–11), and Social Impression (Items 12–15).
From the MOS-X to the MOS-X2: Streamlining the measurement
After using the MOS-X for 15 years, it became clear that it was useful for research purposes, but it had two shortcomings for practical user experience (UX) work. One was the number of items that study participants needed to rate to get an MOS-X score. The other was the level of detail in the item content, which was difficult for participants without a background in speech technologies to understand. The MOS-X2 (Figure 3) was developed to address those shortcomings. The MOS-X2 has just four items, one for each factor of the MOS-X. The number of response options was increased to 11 (0–10-point scale) to help compensate for an expected reduction in reliability.
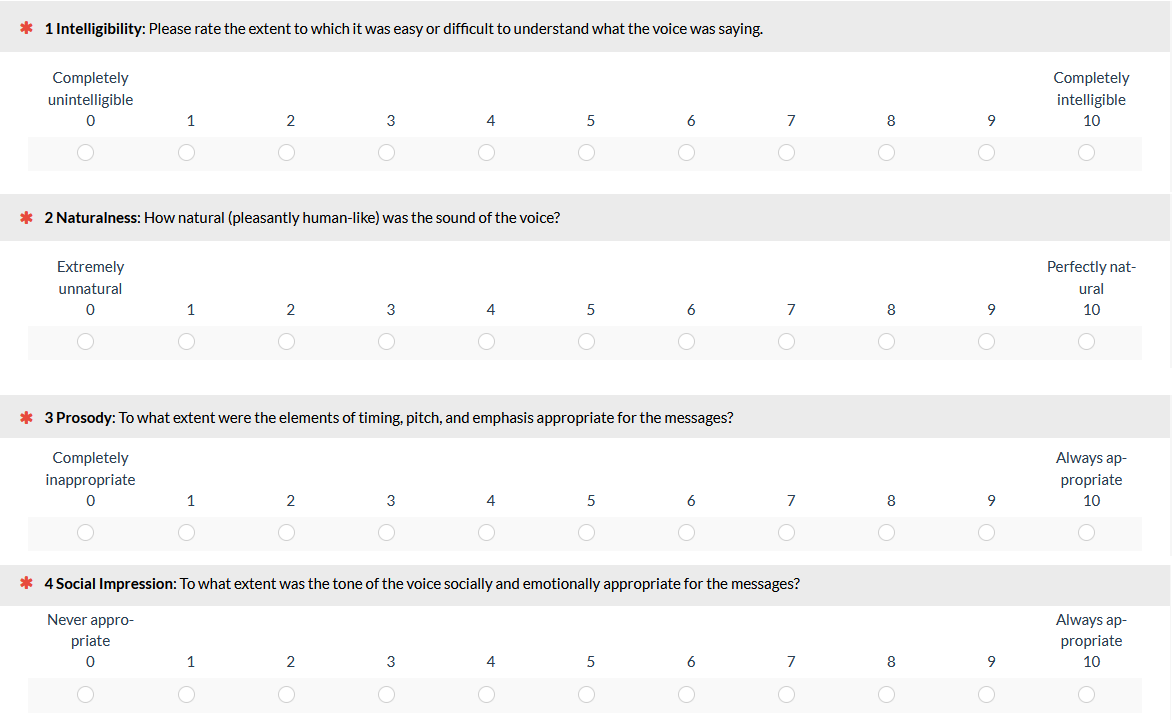
Figure 3: The Mean Opinion Scale Expanded Version 2 (MOS-X2).
In a between-subjects study (Lewis, 2018), 865 IBM employees volunteered to use the MOS-X and MOS-X2 to rate 56 thirty-second recordings of speech samples, of which 53 were synthetic voices developed from 2001 through 2017 and three were recordings of professional human voice talents. They also rated each voice for its overall quality and answered the likelihood-to-recommend question for use in a service system (both 0–10-point scales).
Factor analysis of the MOS-X produced a four-factor structure similar to Polkosky and Lewis (2003). The first four items clustered together alone on one factor (Intelligibility). The last four items also clustered together on a factor (Social Impression), but that factor also had strong item loadings from some items formerly associated with Naturalness and Prosody (Items 5, 8, and 9). When analyzed together, the four items of the MOS-X2 align as expected with the MOS-X factors. The reliability of the MOS-X factors ranged from .90 to .93. The overall MOS-X2 had a slightly lower but acceptably high reliability (.85).
Regression models: Surprisingly better results with the four-item MOS-X2
Regression models predicting overall quality and likelihood-to-recommend were significantly better when using the items of the MOS-X2 as predictors than when using the MOS-X factors (p < .10 for LTR; p < .05 for Overall Quality). As shown in Table 1, variation in the item ratings of the MOS-X2 accounted for almost 75% of the variation in the likelihood to recommend the voice for use in a service system and 82.5% of the variation in overall quality, leaving little opportunity for improvement in the models.
| Beta Weights | ||||||
|---|---|---|---|---|---|---|
| Predictors | Predicting | Intelligibility | Naturalness | Prosody | Social Impression | R² (adjusted) |
| MOS-X Factors | LTR | 0.133 | 0.428 | 0.229 | 0.134 | 68.5% |
| MOS-X2 Items | LTR | 0.111 | 0.479 | 0.193 | 0.209 | 74.2% |
| MOS-X Factors | Overall Quality | 0.221 | 0.396ª² | 0.261 | 0.108 | 75.3% |
| MOS-X2 Items | Overall Quality | 0.19 | 0.397 | 0.280 | 0.206 | 82.5% |
Table 1: Beta weights and adjusted R2 for MOS-X and MOS-X2 models of overall quality and LTR.
Development and use of benchmarks for the MOS-X and MOS-X2
The ratings of human speech (three samples) and synthetic speech (53 samples) from Lewis (2018) provided a normative sample for developing interpretive benchmarks for overall MOS-X and MOS-X2 scores. Although not a random sample of synthetic voices, they were representative of the advances in TTS quality from 2001 to 2017. After arranging the synthetic samples from highest to lowest scores, the top and bottom 15 percentiles were assigned respectively to A and F, the center 40 percentiles were assigned to C, and the remaining two groups of 15 percentiles were assigned to B and D. The percentiles for A, B, and C were further divided into plus, neutral, and minus grades, as shown in Table 2, which also shows the scores that match those given to the human voices (scores at or above 85.3). To use the benchmarks, convert raw MOS-X and MOS-X2 scores to a 0–100-point scale.
For the MOS-X, compute the mean of the 15 items, which will be a number between 1 and 7. Subtract 1 from the mean, then multiply by 100/6. For example, a mean of 5.5 converts to 75; a mean of 6.0 converts to 83.3.
For the MOS-X2, compute the mean of the four items, which will be a number between 0 and 10. Then multiply by 10. For example, a mean of 7.5 converts to 75; a mean of 8.3 converts to 83.
| MOS-X | MOS-X2 | Grade |
|---|---|---|
| 85.3-100 | 85.3-100 | Human-like |
| 74.3-100 | 79.8-100 | A+ |
| 72.7-74.2 | 73.3-79.7 | A |
| 69.8-72.6 | 71.5-73.2 | A- |
| 68.5-69.7 | 70.9-71.4 | B+ |
| 65.3-68.4 | 69.7-70.8 | B |
| 63.6-65.2 | 67.7-69.6 | B- |
| 60.0-63.5 | 66.3-67.6 | C+ |
| 57.1-59.9 | 63.5-66.2 | C |
| 54.7-57.0 | 61.3-63.4 | C- |
| 44.9-54.6 | 54.0-61.2 | D |
| 0-44.8 | 0-53.9 | F |
Table 2: Preliminary curved grading scales for the MOS-X and MOS-X2.
Summary and Takeaways
In an evolution spanning almost 20 years, the MOS has gone from:
- A seven-item questionnaire (with some psychometric weaknesses) addressing two factors of critical importance to the quality of synthetic speech (Intelligibility and Naturalness).
- To a psychometrically stronger nine-item questionnaire (MOS-R) covering the same domain.
- To an expanded 15-item questionnaire (MOS-X) more applicable to the evaluation of synthetic speech in conversational systems (including measurements of Prosody and Social Impression).
- And finally, to a concise questionnaire (MOS-X2) that, despite having only four items, is highly predictive of ratings of overall voice quality and likelihood to recommend for use in service systems.
Much like the grading scales we have developed for the System Usability Scale, we expect the grading scales for the MOS-X and MOS-X2, preliminary as they are, to be very useful in the evaluation of the user experience of systems that use synthetic speech.
Researchers who anticipate needing the additional item detail in the MOS-X can do so, but for most purposes, we recommend using the MOS-X2 because it’s more concise than the 15-item MOS-X, easier for participants to complete, and more predictive of ratings of overall quality and likelihood-to-recommend.