 In a typical week, we are asked to complete surveys on everything: our most recent restaurant experience, our interaction with an airline’s customer service department, and our recollection of our last online purchase, to name just a few.
Surveys are ubiquitous. Not surprisingly, many people hold strong opinions about their proper usage in applied research generally and in UX research specifically.
Surveys aren’t going anywhere because they are an easy way to collect input from many people quickly. But that doesn’t mean they can’t be improved. Improvement starts with a good foundation of survey history and terminology. And that’s what we’re covering in this article and in our book Surveying the User Experience.
How long have surveys been around?
Based on the ubiquity of web-based surveys, it can sometimes seem like surveys have been around for only a few decades. Turns out, they’ve been used in their modern form for over 250 years, and earlier versions (censuses) have been around for over a thousand years.
Figure 1 provides a timeline of key dates showing that surveys have a rich and long history (including records from around 3800 BCE of ancient Egyptians using a census for taxing their population). It seems that death, taxes, and maybe even surveys have been certain for at least five thousand years!
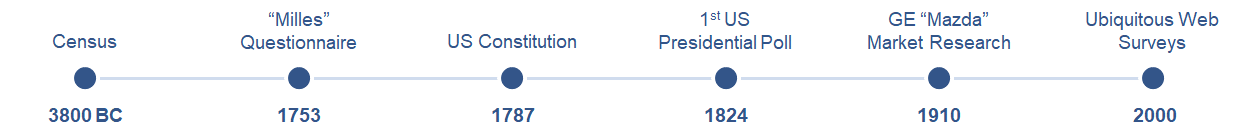
Figure 1: A history of key milestones in surveys.
The next spot on the timeline is the 1753 “Milles” questionnaire, which had 120 questions about the history of the parishes of the Diocese of Exeter. It achieved an enviable 57% response rate.
In 1787, the US Constitution established the national census (“The actual enumeration shall be made within three years after the first meeting of the Congress of the United States, and within every subsequent term of ten years, in such manner as they shall by law direct”).
Polling comes from a 13th-century English word that means “head,” as in counting heads. The earliest known opinion poll was taken of prospective voters in the US presidential election campaign of 1824.
A more modern usage of these methods was market research on the Mazda lightbulb (not the car) conducted by Cosmopolitan magazine for General Electric in 1910 to assess user reaction to the product name.
Finally, our historical tour stops around 2000 with the introduction of the now-ubiquitous web surveys.
Are censuses, polls, surveys, and questionnaires the same?
These terms are used somewhat interchangeably. While they are similar, there are some important differences. These similarities and differences are evident in their definitions:
- Census: The distinguishing characteristic of a census is the gathering of information by a government about an entire population rather than a sample, with a historical focus on taxation and allocation of resources.
- Poll: Historically, polls are strongly associated with voting (e.g., polling stations), which carries over to the practice of opinion polling of a sample of prospective voters. In current practice, polls are short surveys usually focused on some preference or choice, and they are often but not always political.
- Survey: The distinguishing characteristic of a survey is gathering information from a sample of the target population. The information collected can be demographic, attitudinal, intentional, or experiential.
- Questionnaire: A questionnaire is a set of questions answered by the respondents in a census, poll, or survey. A standardized questionnaire comprises items that have undergone the process of psychometric evaluation.
How many types of survey are there?
There are quite a few different types of survey. If we narrow them down to the most common ones in the fields of UX and CX research, many fall within two broad groupings: (1) Attitudes, Experiences, and Intentions, and (2) Individual Differences/Demographics. From that high-level categorization, Figure 2 shows a taxonomy of over 50 types of survey.

Figure 2: Taxonomy of common survey types used in user and customer research.
What are the advantages of using standardized questionnaires?
A standardized questionnaire has gone through the process of psychometric validation. While that sounds like a psycho with a yardstick, it actually means someone spent a lot of time going through dozens or hundreds of possible questions and winnowed the set down to the most reliable, valid, and sensitive. Usually, this is done by having a representative group of participants answer the candidate questions in response to a diverse set of interfaces.
Advantages of standardized questionnaires include at least the following:
- Reliability (consistency of measurement)
- Validity (measurement of specific constructs)
- Sensitivity (ability to discriminate good and bad scores)
Where did standardized UX questionnaires come from?
The roots of the standardized questionnaire date back over 100 years. The most recent evolution of standardized UX questionnaires began in the 1970s with the assessment of management information systems, followed by the assessment of usability and usefulness in the 1980s and 90s, and the distinction between pragmatic and hedonic usability in the 2000s (Figure 3).
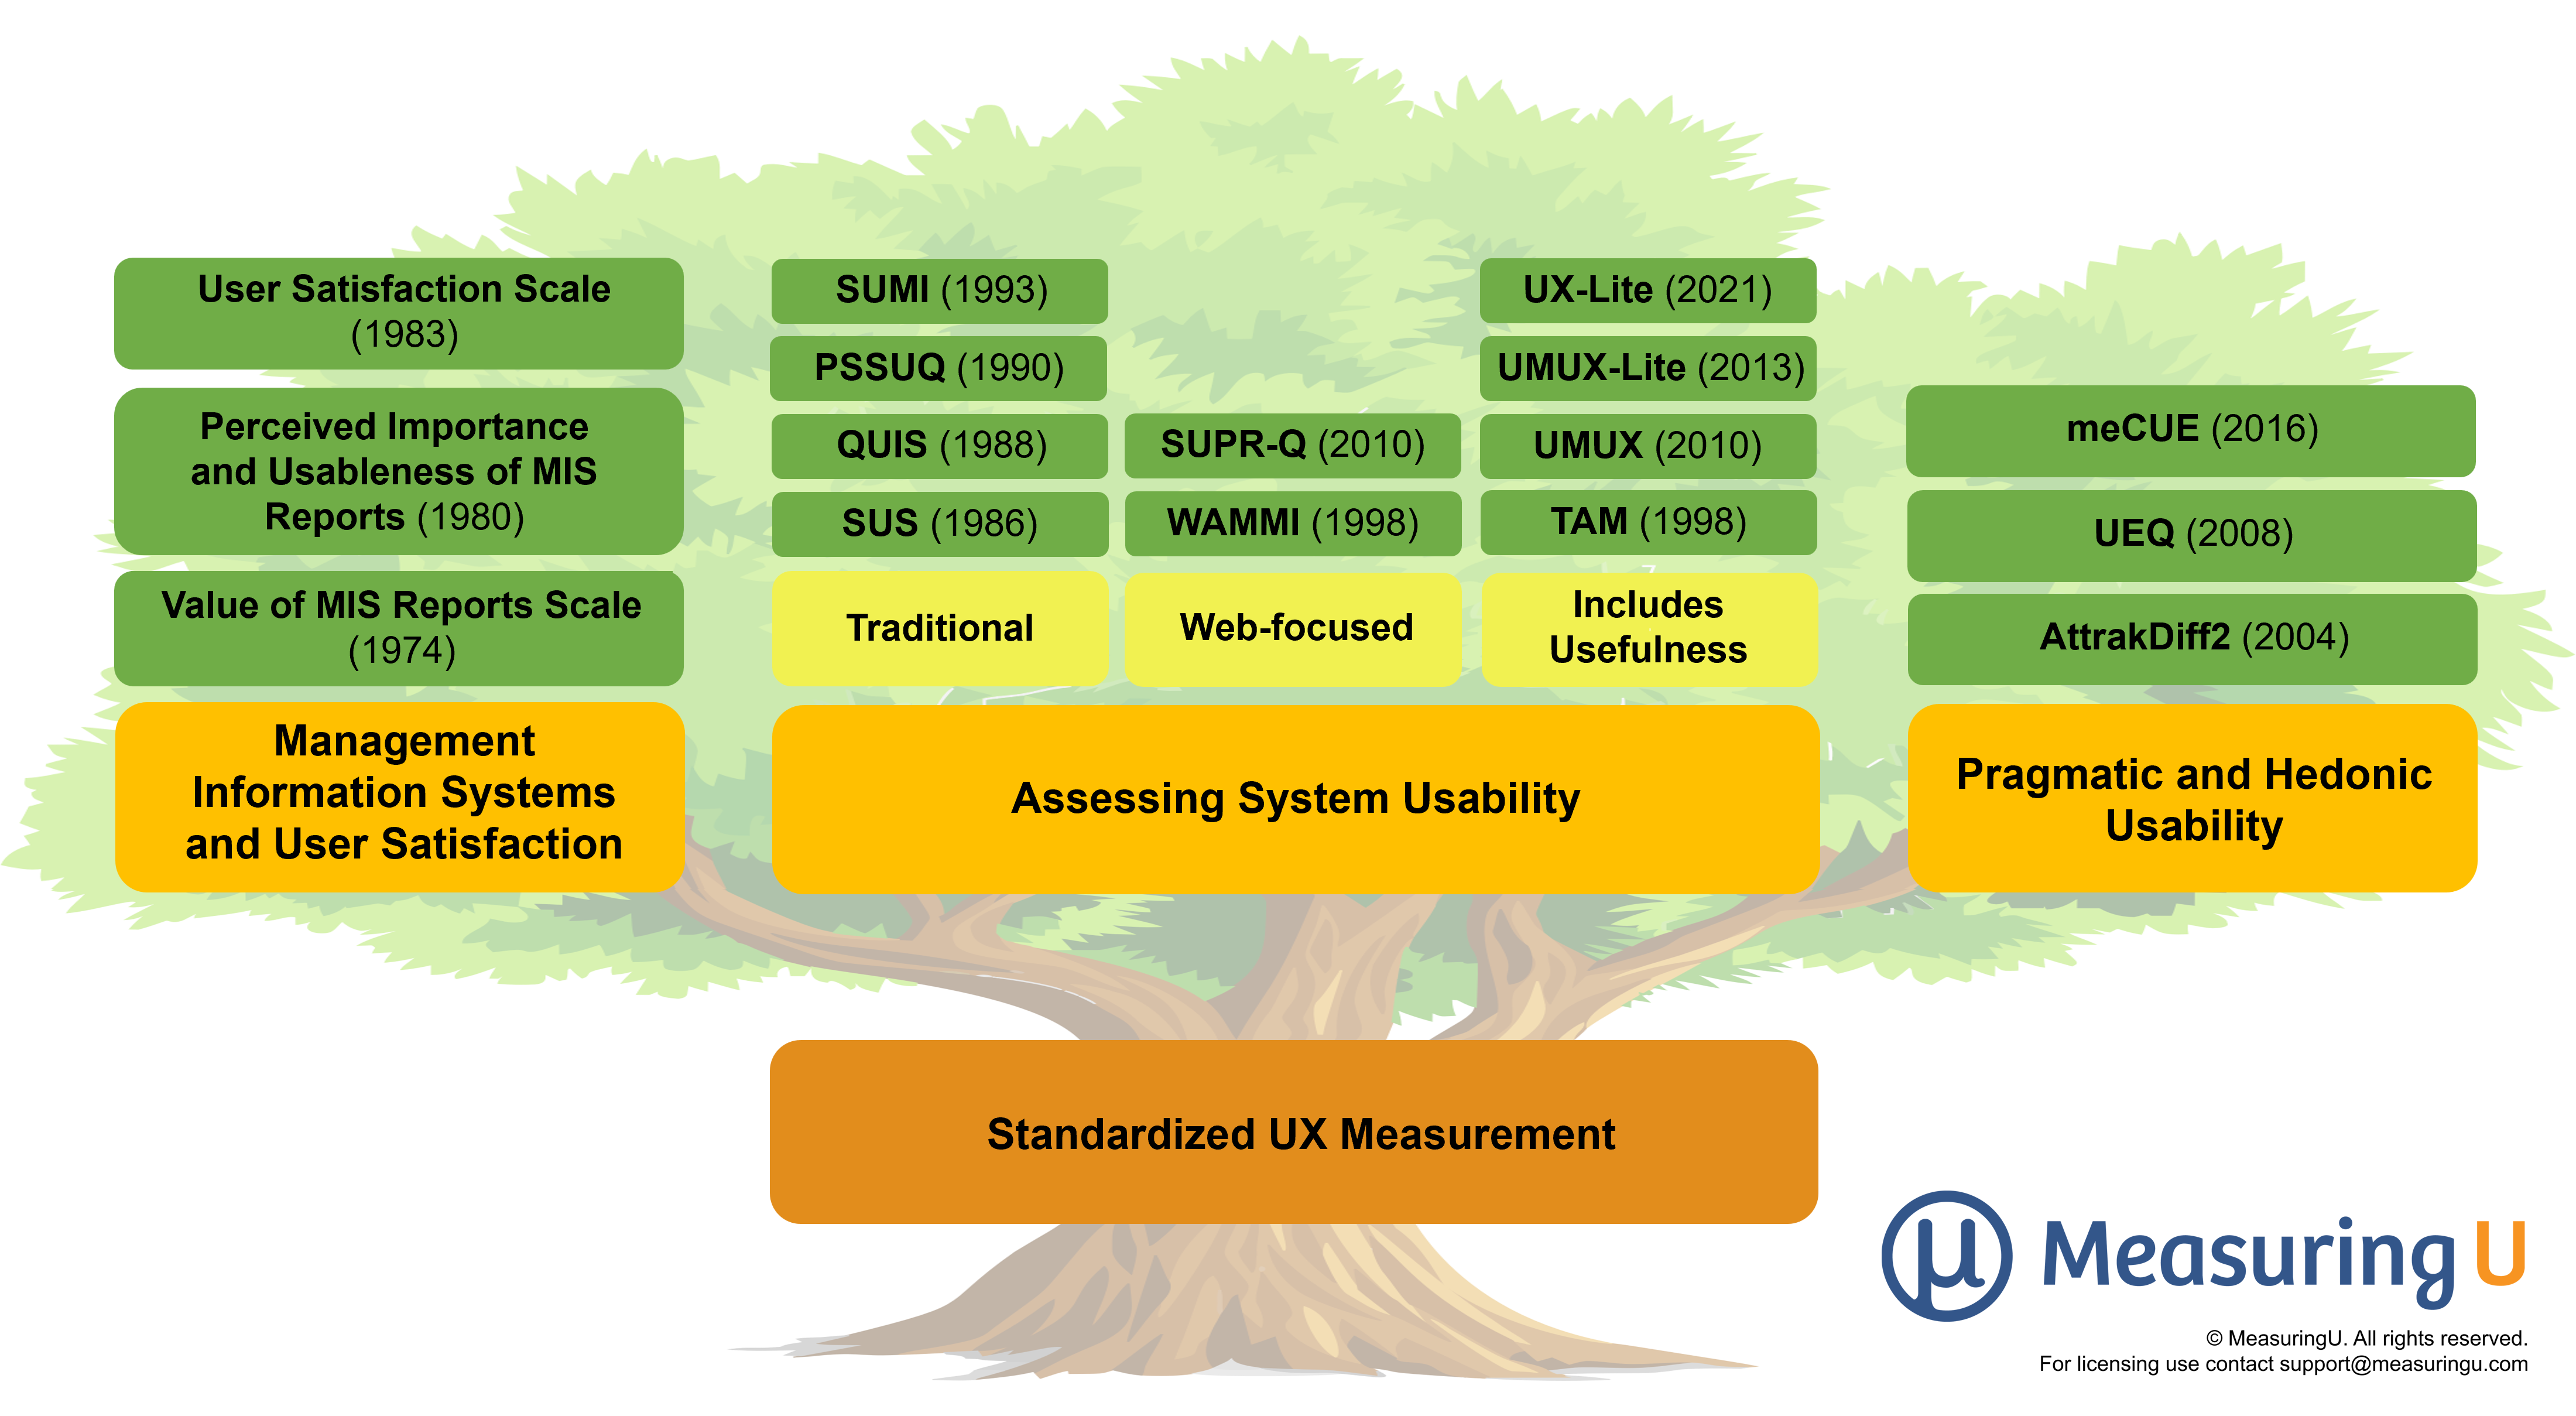
Figure 3: The three branches of UX measurement.
When is a survey the right research method?
As shown in Figure 4, surveys remain a popular research method, showing up as the third-most-popular method according to the 2022 survey sponsored by the User Experience Professionals Association (UXPA).
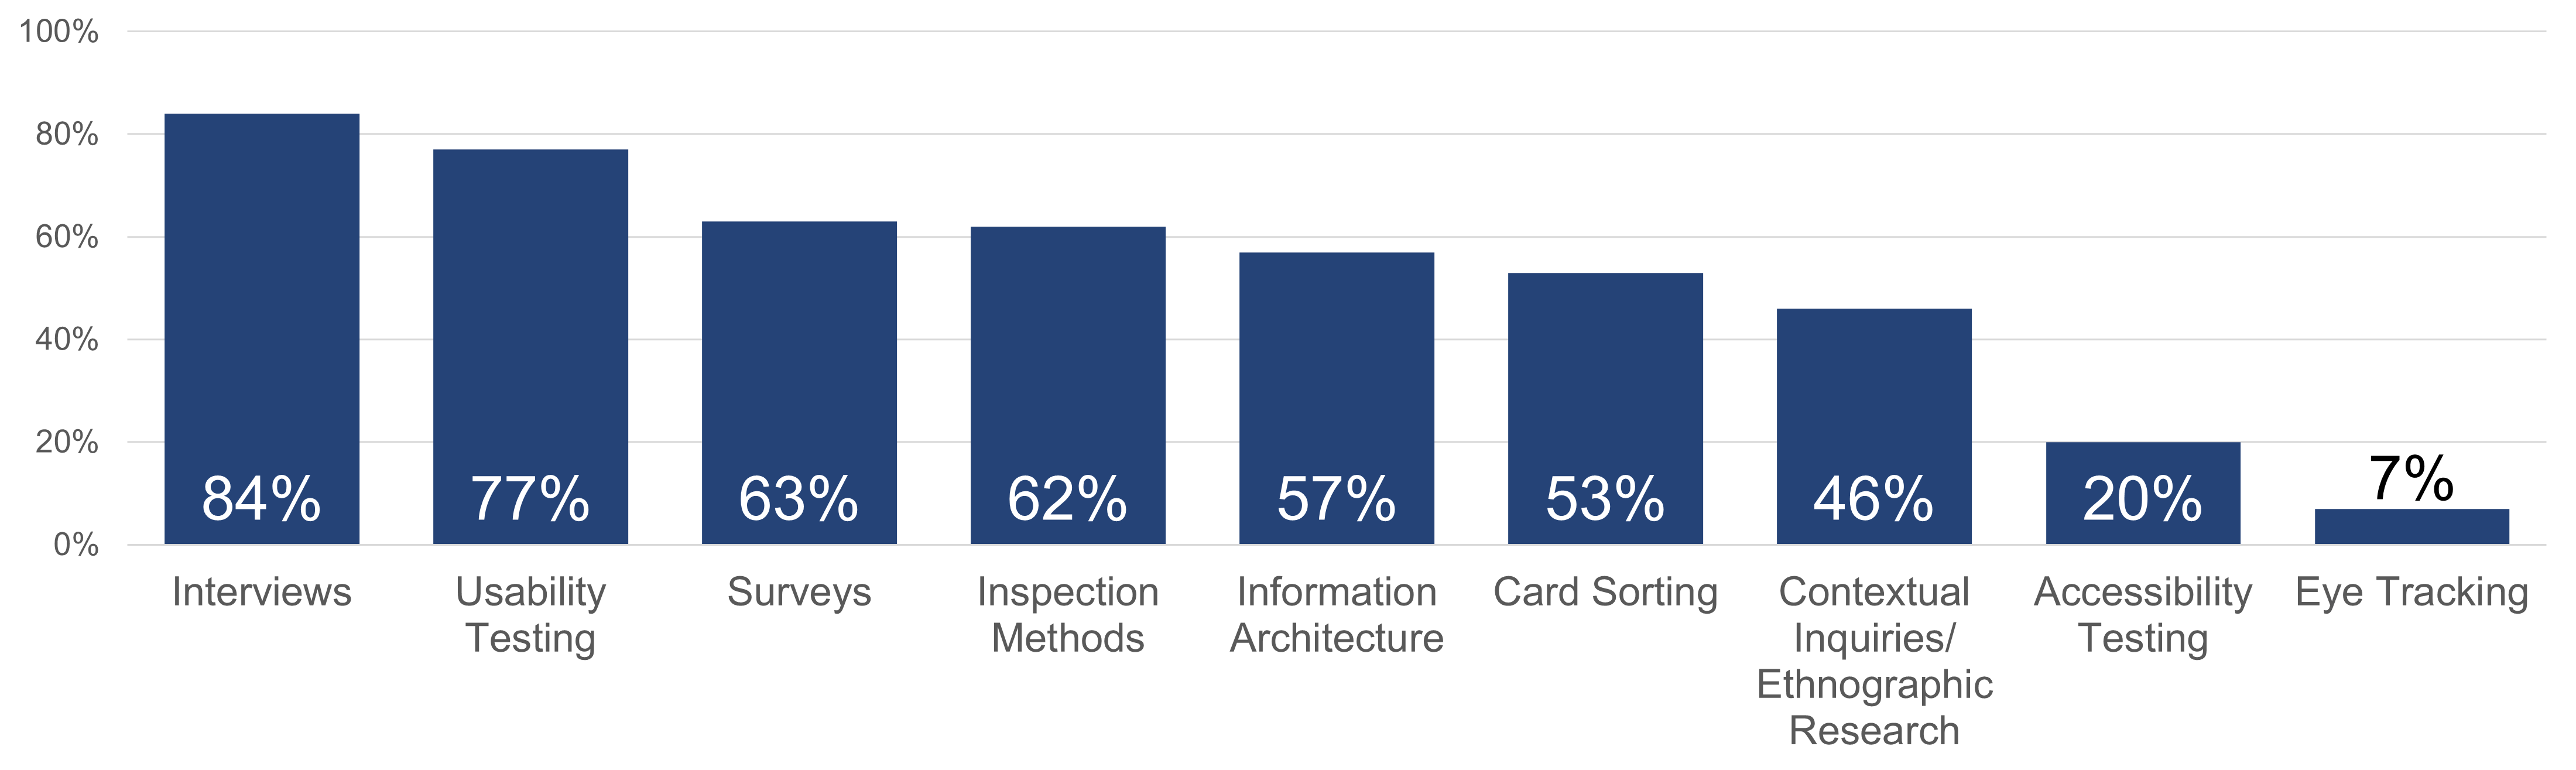
Figure 4: The methods UX professionals use (data from UXPA 2022 survey).
Generally, surveys are the better method when the focus is on quantification. Surveys are no substitute for qualitative inquiry, but they can be useful in UX/CX research for:
- Identifying your users (e.g., demographics, customer segmentation)
- Identifying the most important product features/content
- Benchmarking attitudes/intentions
- Identifying key drivers of attitudes
What are the first steps in planning a survey?
Picking the right method is a good start. Addressing the research and business questions is the essential next step. It’s all too easy to slap together a survey to quickly collect data. Instead of defaulting to a long list of standard demographic questions, start with a list of research goals and hypotheses and then craft the survey items you need to collect data to answer the research questions. Of course, those can include demographics.
For example:
- How is our brand received/perceived and how is it compared to competitors?
- How loyal are our customers?
- What are the most important features?
With that list, you can start constructing a research grid to identify how you’ll address each goal/hypothesis in the research study. For example, you can use a grid like the one in Figure 5 to reveal gaps (missing coverage of goals/hypotheses) and bloat (excessive coverage).
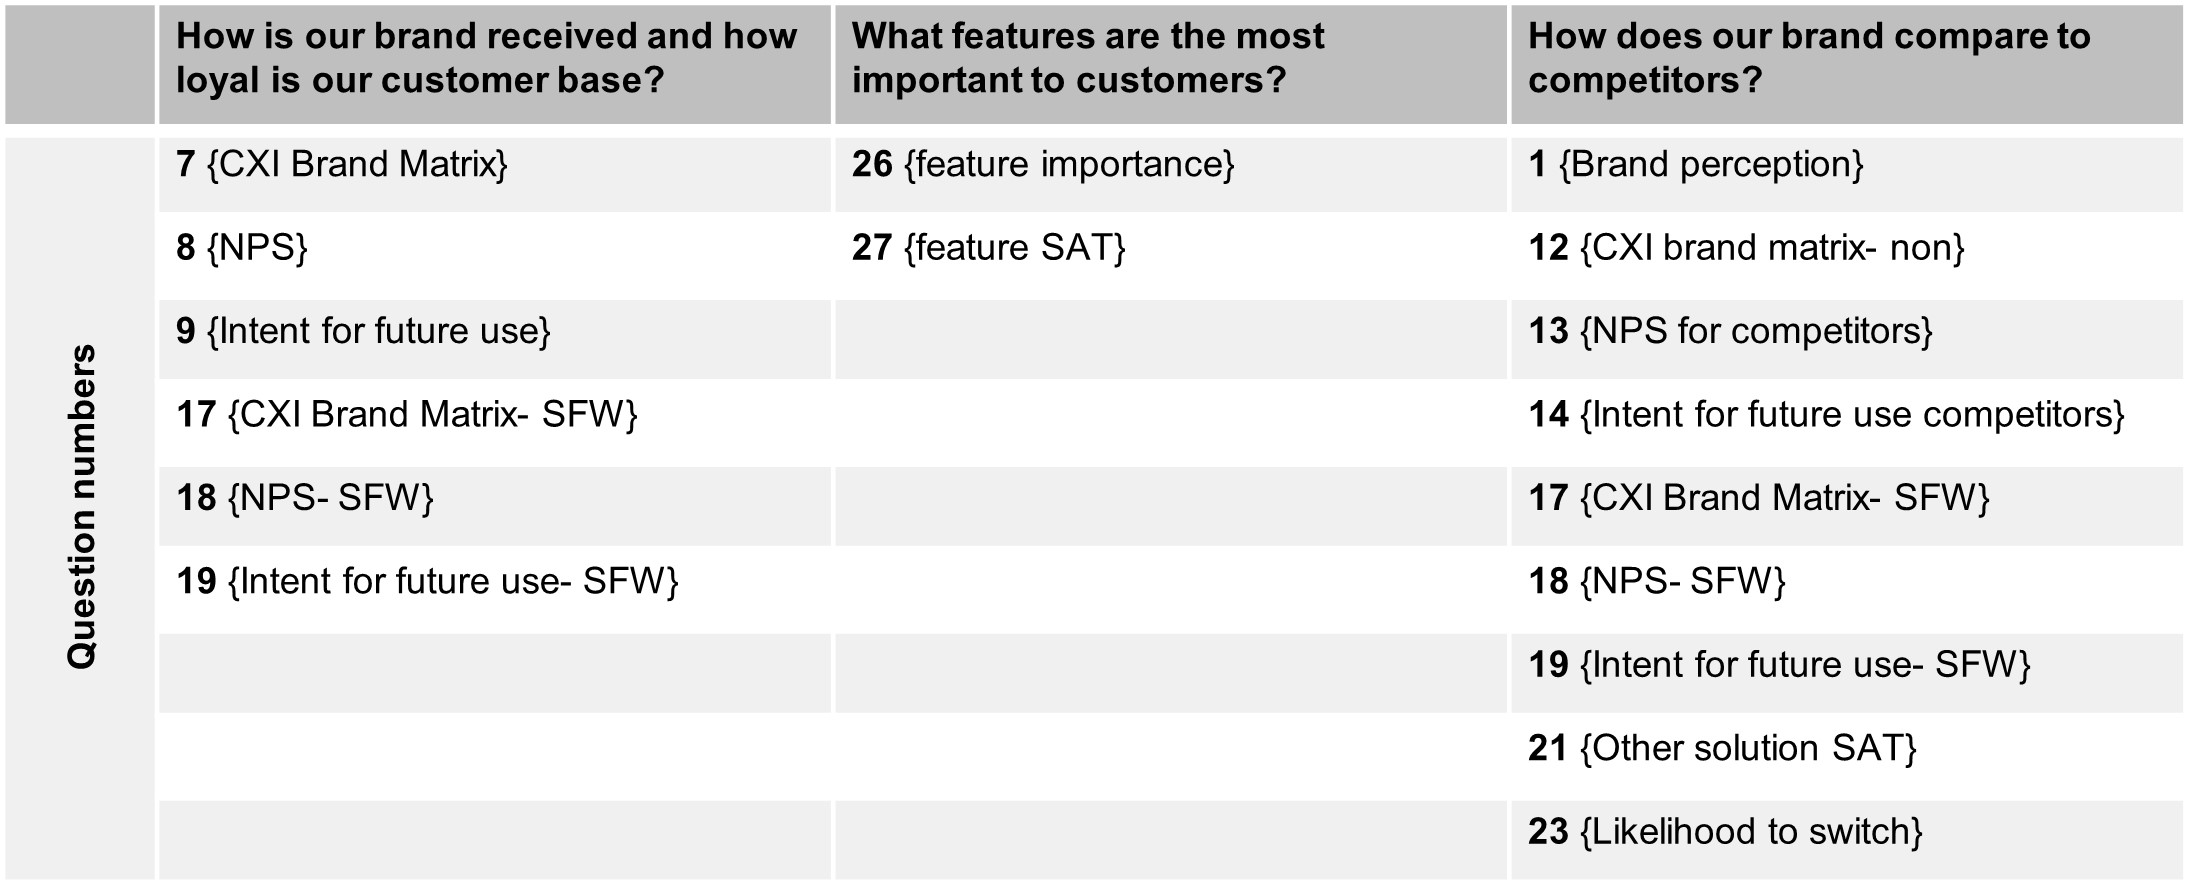
Figure 5: Example of a research grid from a customer satisfaction survey.
Looking to learn more?
We’ve written a lot on survey foundations and the entire survey creation process, from writing questions to selecting response options to collecting and analyzing data. You can find plenty more in our book, Surveying the User Experience. We also have a companion course that follows the book on MeasuringUniversity.com. You can use our MUiQ platform to build surveys and collect data.


