 Online grocery shopping has increased substantially over the past few years due to the COVID-19 pandemic. In 2019, online grocery sales grew steadily, but they accounted for only a modest portion of sales. Now, online grocery sales are booming, with estimated annual sales of 97.7 billion in 2021, an impressive 57% increase for the market in just two years.
During COVID, many of the largest grocery chains in the U.S. had to quickly scale their online shopping experience to try and keep up with customer demand. Some grocery chains chose to partner with third-party services to outsource elements of the e-commerce grocery experience to meet that demand. Publix, a popular grocery store in the southeast U.S., partnered with Instacart, and now Instacart hosts Publix’s entire online grocery shopping and delivery experience.
As health concerns related to COVID decrease and more customers feel comfortable shopping in person again, it’s unclear what percent of shoppers will continue their pandemic habits of online shopping.
To find out what aspects of online grocery shopping are driving customer attitudes and behaviors and which companies are excelling, we compared the online shopping user experience of some of the largest U.S. grocery chains:
We collected SUPR-Q® and Net Promoter data, investigated reasons for using the websites, measured users’ attitudes regarding their experiences, conducted key driver analyses, and analyzed reported usability problems.
Benchmark Study Details
Between December 2021 and January 2022, we asked 390 online grocery shoppers in the U.S. to recall their experience shopping for groceries online with one of the above websites in the past year.
Participants completed the eight-item SUPR-Q (which includes the Net Promoter Score), answered the UX-Lite standardized questionnaire, and answered questions about brand attitudes, usage, and their prior experiences.
When a parent company owned stores under multiple brands, we sampled users of the largest store brand of that parent company. For example, Ahold Delhaize USA is one of the country’s top grocery retailers and the parent company of Food Lion, Stop & Shop, and Hannaford. Food Lion has the most physical locations. So, we recruited participants who specifically shopped online at Food Lion.
Quality of the Grocery Website User Experience: SUPR-Q
The SUPR-Q is a standardized measure of the quality of a website’s user experience, and it has become the standard for measuring attitudes toward the quality of a website user experience. It’s based on a rolling database of around 200 websites across dozens of industries.
SUPR-Q scores are percentile ranks that tell you how a website experience ranks relative to the other websites (50th percentile is average). The SUPR-Q provides an overall score as well as detailed scores for subdimensions of usability, trust, appearance, and loyalty.
The eight grocery websites in this study collectively averaged at the 79th percentile. H-E-B scored best at the 99th percentile, and Walmart scored the lowest at the 58th percentile.
Usability Scores and Trust
We asked participants to reflect on how easy they thought it was to use and navigate through the websites. H-E-B had the highest usability score (97th percentile) and Kroger had the lowest (52nd percentile). Comments about Kroger’s usability included
“When I first started using the site, I didn’t immediately see how to shop at the site. I’ve used the Walmart site and Instacart on many occasions, but the Kroger site was a little more difficult to just sit down and start using.”
“I feel like it could be organized a bit differently. Sometimes, when I don’t know what department a product is in, I have to do a lot of searching just to find it and it becomes a hassle.”
We also asked participants to reflect on the trust and credibility of the grocery website. H-E-B also had the highest trust score (99th percentile), and Walmart had the lowest (55th percentile). Based on respondents’ feedback, this may be related to the number of third-party retailers on the website.
“One problem I noticed was that the items are not all sold by Walmart, so if you do not read carefully, you may accidentally buy from an unreliable source. This is misleading and concerning.”
“A few of the items look to be sourced from third-party retailers, which makes me question the quality of some items.”
More verbatim comments are available in the downloadable report.
Loyalty/Net Promoter Scores
All the online grocery services received a positive NPS (more promoters than detractors) and the average NPS was 16%. H-E-B received a notably high NPS (65%), while Meijer received a relatively low score of 2%.
In general, a better user experience is a good predictor of customer loyalty.
Use of Grocery Websites and Mobile Apps
As a part of this benchmark, we asked participants how they accessed the online grocery services. All participants reported using their desktop/laptop computers (this was a requirement for participation in the survey), with 65% also using mobile apps and 59% using mobile websites. This is a relatively high mobile app usage, similar to rates we have seen in recent years for food delivery apps such as DoorDash (75%) and seller marketplace apps such as Etsy (79%).
The typical frequency of use was a few times a month for websites and never for mobile apps. The most frequently used mobile app was Kroger’s.
Components of the Grocery Experience
Across the websites, using a series of five-point scales (see Key Drivers), we computed the top-two-box percentages of items with which respondents rated components of the grocery website experience. Across the sites, 89% of participants thought product images were clear and 84% thought the checkout process was smooth. At the lower end of the ratings, 51% were happy with substitutions the store chose for them, and only 45% thought it was easy to tell when an item was low in stock.
Key Drivers
To better understand what affects SUPR-Q scores and Likelihood-to-Recommend (LTR) ratings, we asked respondents to agree/disagree with the following attributes of the grocery websites on a five-point scale ranging from 1 (Strongly disagree) to 5 (Strongly agree). We conducted key driver analyses (regression modeling) to quantify the extent to which ratings on these items drive (account for) variation in overall SUPR-Q scores and, separately, LTR (the rating from which the NPS is derived).
- It’s easy to find exactly what I want
- It’s faster than going to a brick-and-mortar store
- I can quickly find the brands I want
- The checkout process is smooth
- Product images are clear
- I can easily find deals and discounts
- It’s easy to see exactly how much I’ll be charged
- Product descriptions are clear
- It’s easy to browse for items using the menu
- It’s easy to search for items
- The search results are relevant
- I can find previously ordered items easily
- I can easily select a time for pickup/delivery
- Finding and applying coupons is easy
- I can tell when an item is low in stock
- It is easy to identify substitutes when a specific item I want is out of stock
- My groceries come in the condition I expect them to
- It’s easy to make changes to my order
- When the store makes substitutions, I’m happy with them
- I’m confident that I am not charged for items that were not delivered
- My order is ready at the designated pickup/delivery time.
- I am pleased with the freshness of the groceries I order
Key Drivers Include Smooth Checkout, Finding Desired Products Easily, and Fresh Perishables
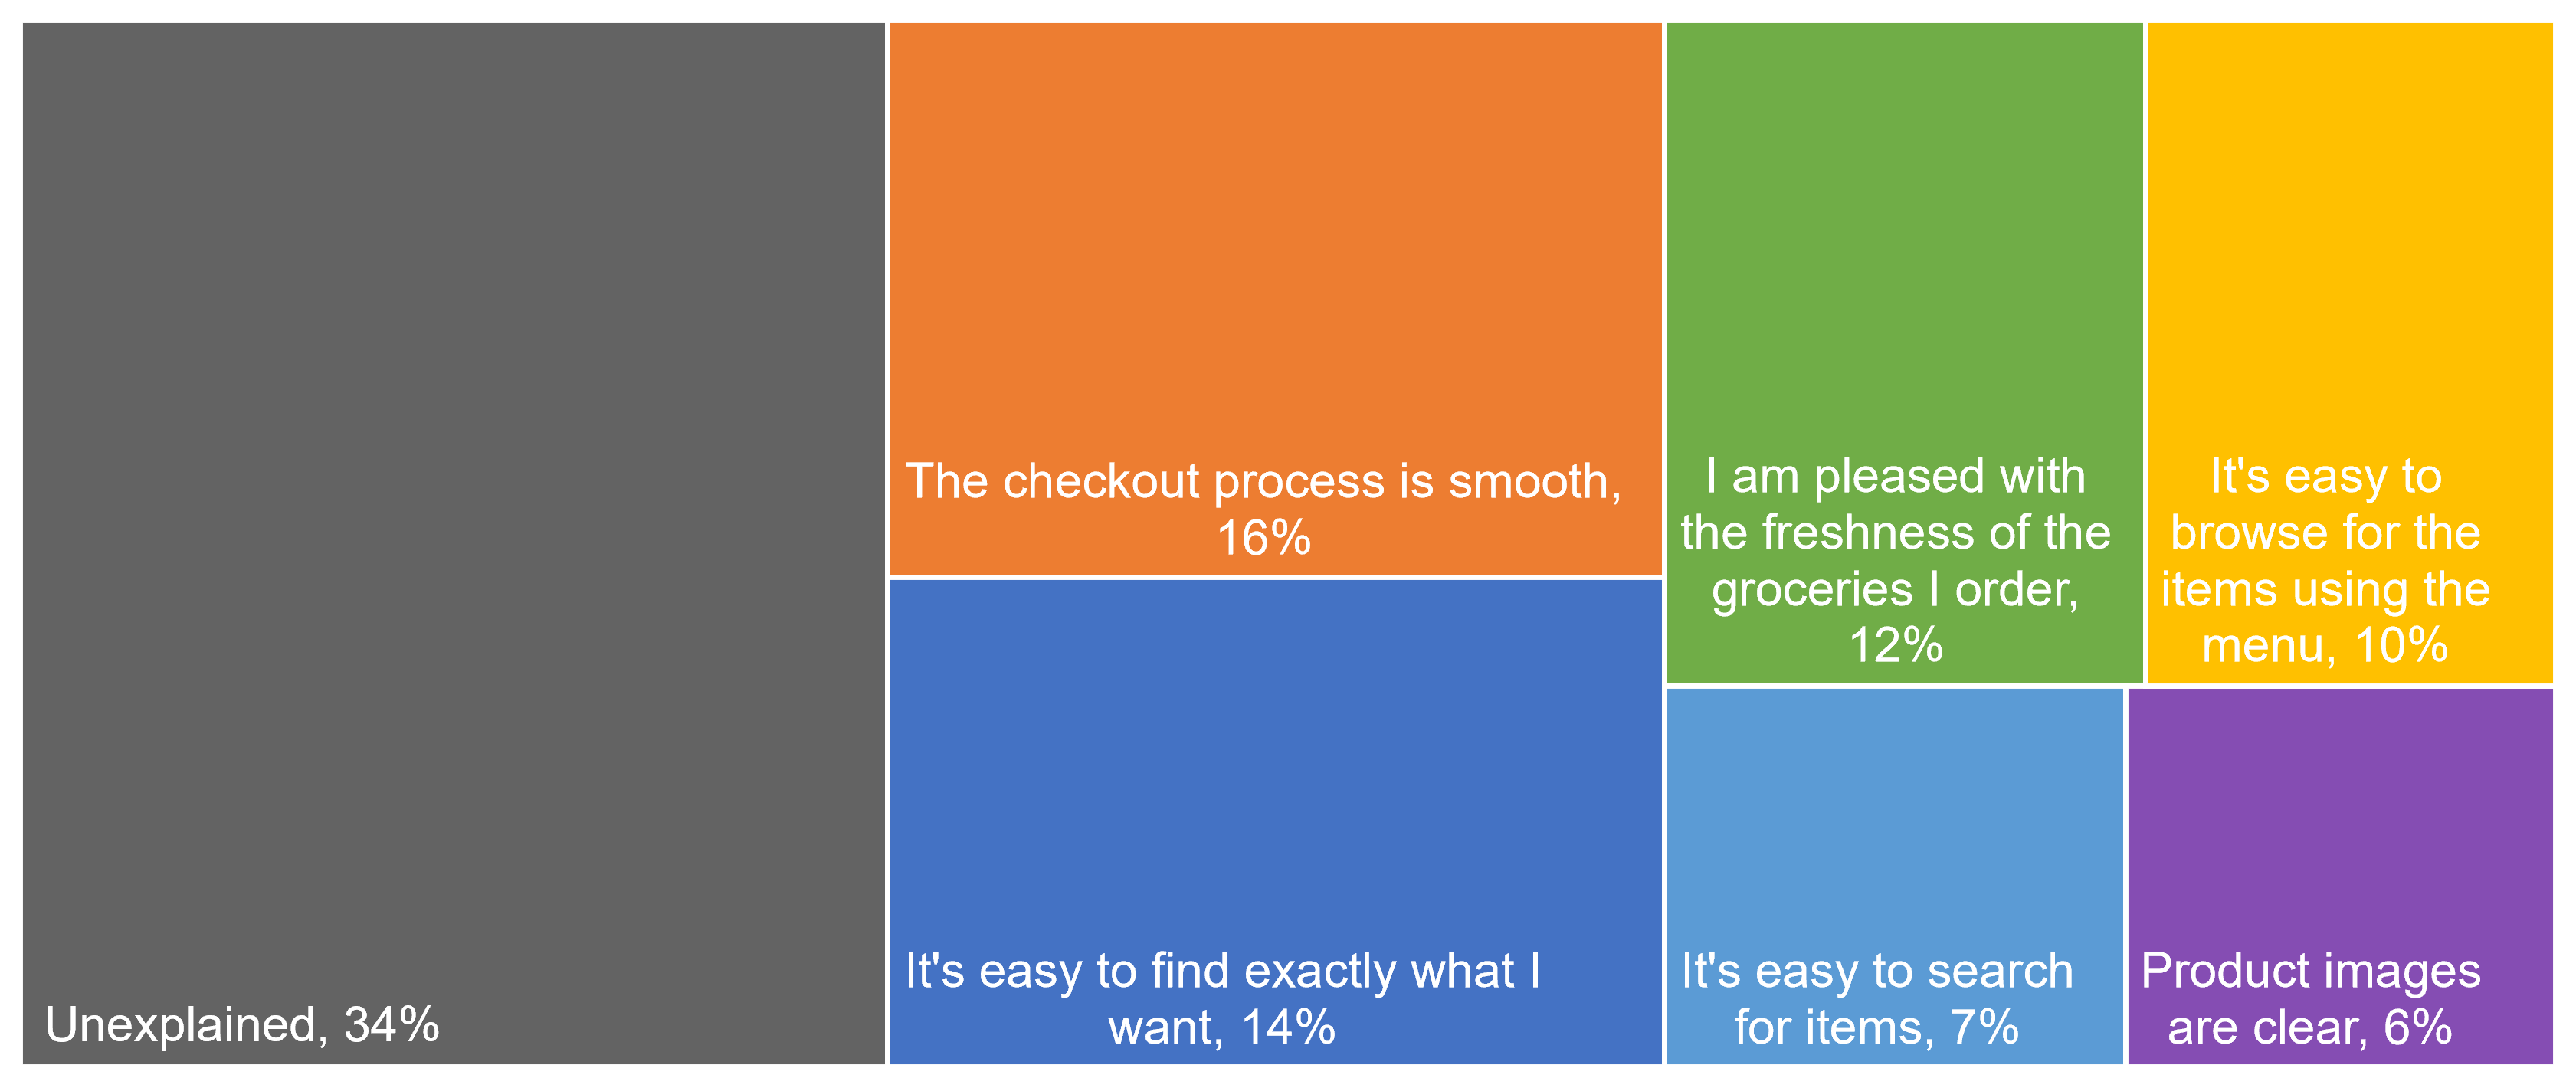
SUPR-Q Drivers. As shown in Figure 1, the top key driver from the list above was “The checkout process is smooth” (accounting for 16% of SUPR-Q variation). Top-two-box scores of this driver ranged from 73–96%, with H-E-B receiving the 96%. Other significant key drivers were “It’s easy to find exactly what I want” (14% of variation; top-two-box scores ranging from 70–80%; Publix scored highest), and “I am pleased with the freshness of the groceries I order” (12% of variation; top-two-box scores ranging from 70–91%; Whole Foods scored highest).
LTR Drivers. Of the 22 items in the attributes list, five accounted for significant amounts of variation in the ratings of likelihood-to-recommend (which is the measure from which the NPS is derived). Consistent with the SUPR-Q results, “It’s easy to find exactly what I want” (11%), “I am pleased with the freshness of my groceries” (10%), and “The checkout process is smooth” (8%) were the top three key drivers in the analysis.
What to Improve
There were a few common problems and frustrations that respondents had across the grocery services, such as (1) websites loading pages slowly and (2) having items that were labeled as in stock at purchase being out of stock during fulfillment.
Specific key areas of improvement cited by respondents for each website/app include
- Food Lion: Browsing/Navigation (e.g., “It can be a bit clunky getting from one page to the next. Sometimes, I would just like to browse through items without making a commitment to purchase.”)
- H-E-B: Fulfillment Clarity (g., “The website doesn’t show the H-E-B closest to me, so I have to schedule curbside pickup at the one that is farther from me.”
- Kroger: Browsing/Navigation (g., “It took too long to look through all the options in order to find the one item I wanted.”)
- Meijer: Search Results (g., “You have to be careful not to search too specific of a term or you will not get the results you want. A perfect example is my search for crab legs did not turn up actual crab legs, but when I searched for crab, then I got the result that I was looking for.”)
- Publix: Appearance (g., “It’s a bit bland and undecorated.”)
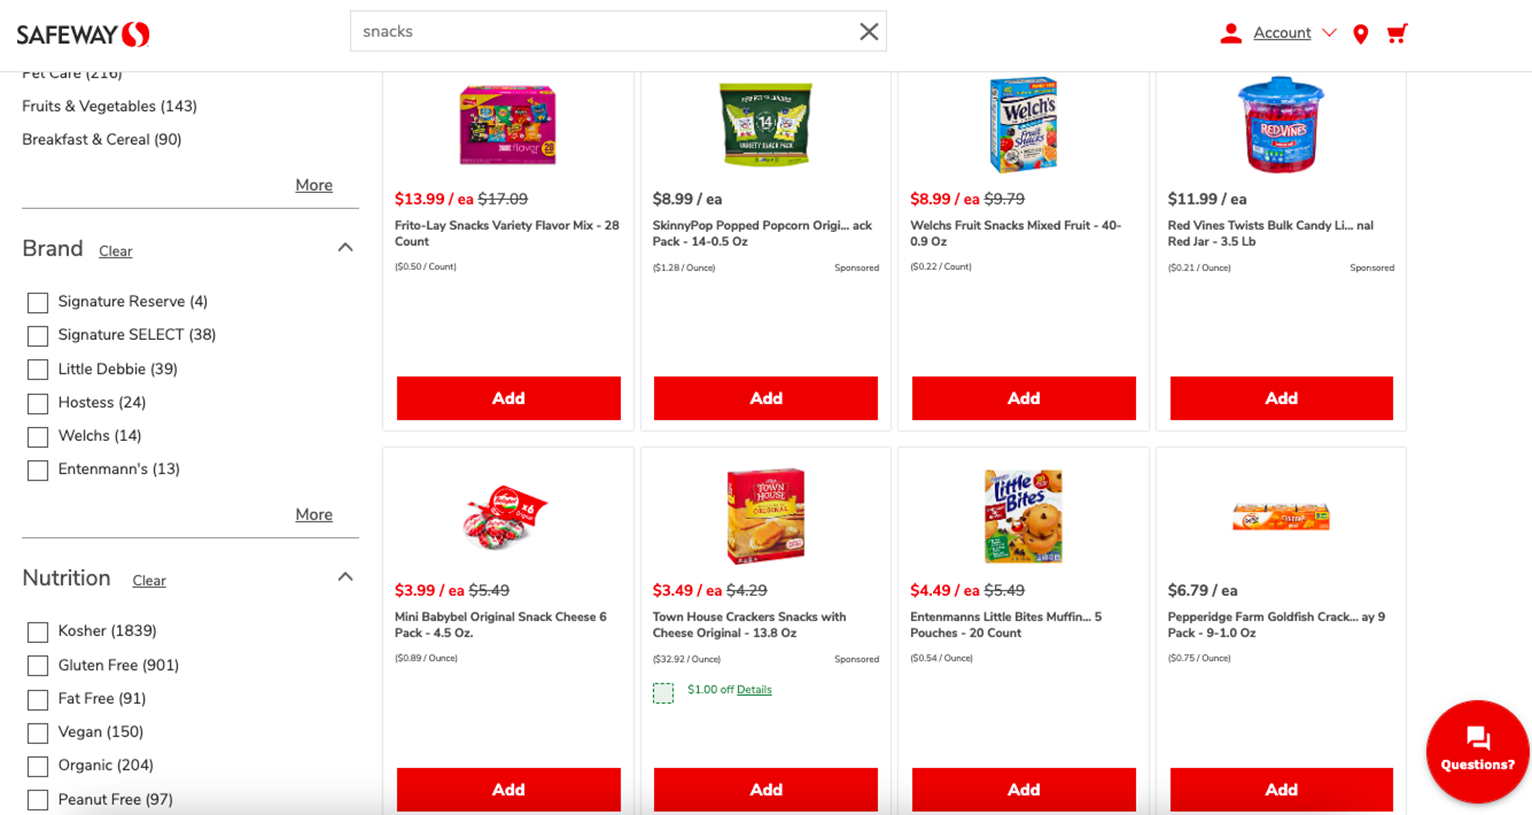
- Safeway: Product visibility (g., “The images are too small… It makes a lot of dead space, and the items all look like they are at a distance. I have to move closer to the screen just to see what product it is.”)
- Walmart: Fulfillment Clarity (g., “The information for the products [delivery, curbside pickup] did not match what was available at checkout.”)
- Whole Foods: Price (g., “It’s usually not worth it to me to pay someone to shop for me and deliver it.”)
Figure 2 shows a screenshot of Safeway’s website highlighting the small product images and text compared to the size of their allocated spaces. There is a lot of empty space. Safeway could increase the size of their images and text so users can see and compare products faster without having to zoom in on the page.
Summary and Takeaways
An analysis of the user experience of the eight grocery websites found:
- SUPR-Q and the NPS were above average. The websites had SUPR-Q scores ranging from the 55th to the 99th percentiles (a mean 79th percentile where the 50th percentile is the average for all websites in our current normative database). The average NPS across the websites was 16% (more promoters than detractors). These results show that this sector enjoys above-average UX and loyalty.
- Users are frustrated by out-of-stock items. On top-two-box ratings, scores ranged from 33–57% for “I can tell when an item is low in stock.” Being able to check out after adding items labeled as in stock to their cart only to find out that some of those items would be out of stock during fulfillment was the most cited frustration.
- Smooth checkout experiences drive SUPR-Q and LTR scores. “The checkout process is smooth” was a top key driver for both SUPR-Q and LTR ratings. Other top drivers for both were “It’s easy to find exactly what I want” and “I am pleased with the freshness of the groceries I order.”
Full details are available in the downloadable report.