 During the fall in the northern hemisphere, leaves change colors, birds fly south, and the temperature gets colder. Do the birds change the color of the leaves, and does their departure make the temperature colder?
What if you gave participants two versions of a rating scale, with the first having responses ordered from strongly disagree to strongly agree and the second reversing the order, and there was a difference in mean scores? Is the difference in ratings caused by the way the responses were presented, or do people change their answers for repeated questions?
When you change a design or alter a method to impact outcome metrics, you want to be sure your intervention caused the change. You don’t want to be misled by other variables.
Latin squares and Greco-Latin squares are techniques researchers use to better understand the effects of variables on metrics. To truly understand what they are and how to use them, we need to know where they come from.
In 1862, during the Civil War, Abraham Lincoln signed into law the first Morrill Land-Grant Act, establishing land-grant universities. Unlike the liberal arts education provided by the private universities of the time, land-grant universities had a mandate to focus on agriculture, science, military science, and engineering. Cornell, MIT, and Tuskegee started as land-grant universities. New Mexico State University (NMSU), founded in 1888, was that territory’s land-grant college. Jim Lewis takes the story from here:
I started work on my Master’s in human factors engineering at NMSU’s psychology department in 1978. The curriculum included a healthy dose of probability and applied statistics, taught by James V. Bradley, author of Probability; Decision; Statistics and Distribution-Free Statistical Tests. He had some interesting idiosyncrasies. He would leave the campus by 4:00 pm every afternoon to get to his trailer in the desert because if he didn’t, he told me his neighbors would “steal everything that wasn’t nailed down.” He would teach t-tests but would not teach analysis of variance (ANOVA) because he didn’t believe psychological data ever met its assumptions.
It was clear from the human factors and psychology literature in the 1970s that few researchers agreed with Dr. Bradley regarding the usefulness of ANOVA. If you expected to have a career in research, either academic or industrial, you had to at least know the fundamentals of ANOVA. The advice I received was, “If you want to learn about experimental design and ANOVA, take the stats classes in the College of Agriculture.” Odd advice, I thought, but that’s what I did. Now, decades later, I have a better understanding of why agriculture departments tend to provide such solid training in experimental design and analysis.
In this week’s article, we discuss the use of Latin and Greco-Latin experimental designs in UX research. From patterns found on thousand-year-old amulets to card puzzles of the early 1700s that inspired new branches of mathematics, Latin and Greco-Latin squares have a rich history: agricultural research in the 1920s, experimental psychology in the 1940s, and UX research today have all been improved with their use.
Solving a Card Puzzle
In the early 1700s, playing cards had already been around for a few hundred years. In addition to card games, there were card puzzles. One popular card puzzle was to take the four highest ranks (Ace, King, Queen, and Jack) from each suit (Spades, Hearts, Diamonds, and Clubs) and arrange them in a four-by-four matrix so that each row and each column of the matrix included a card of each rank and suit. It’s harder than you might think—try it some time.
It turns out that the solution to this puzzle is an example of a Greco-Latin square. Take a look at Figure 1 (Jim arranged these cards himself). Each row and each column have exactly one Ace, King, Queen, and Jack. They also have exactly one Spade, Heart, Diamond, and Club.
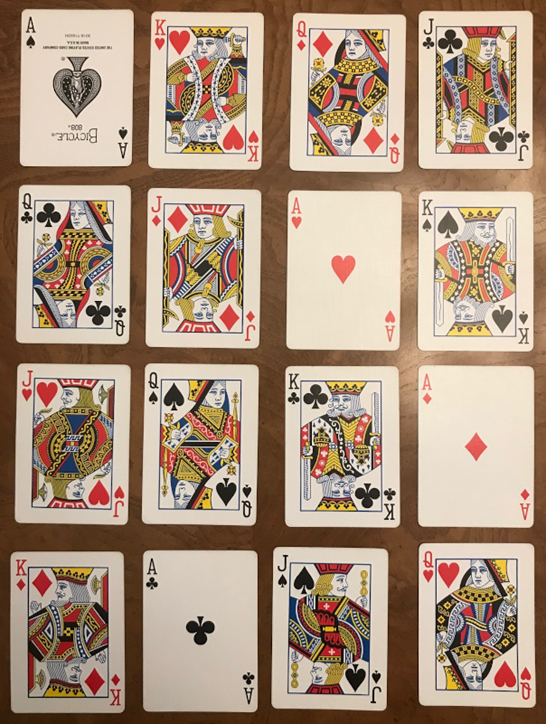
Figure 1: Greco-Latin square solution to a card puzzle from the early 1700s.
If we separate card ranks and suits as shown in Figure 2, it’s easy to see how this Greco-Latin square is constructed through the combination of what are now called mutually orthogonal Latin squares (MOLS).

Figure 2: Separation of the card puzzle solution into two mutually orthogonal Latin squares (MOLS).
Leonhard Euler, Greco-Latin Squares, and Magic Squares
Leonhard Euler, born in 1707, was one of the most important mathematicians of the 18th century, and his work continues to influence modern mathematics. He was certainly aware of this card puzzle and became deeply interested in mutually orthogonal Latin squares. The term Greco-Latin square came from his work on the mathematics of combining squares, where instead of using card ranks and suits, he used Greek and Latin letters to make Greco-Latin squares (Figure 3). When other mathematicians built upon his work by analyzing the properties of single squares, they chose to use Latin letters, so the squares became generally known as Latin squares.
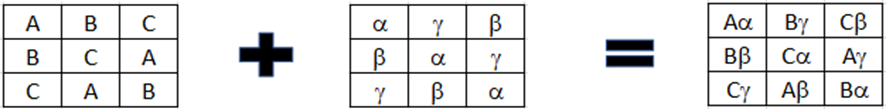
Figure 3: Combining orthogonal squares with Latin and Greek letters to get a Greco-Latin square.
Before we leave Euler, here’s one more example of his work. You may be familiar with magic squares—squares with numbers from one to the number of cells where the sums of each row and column of numbers are identical (Ben Franklin talks about them in his autobiography).
Euler discovered that if you start with zero and assign numbers to the symbols (e.g., card ranks) in one square by adding the width of the square, then start with one and assign sequential integers to the symbols (e.g., card suits) in the other square, when you add the squares you get a magic square. Figure 4 shows that when you do that with the card ranks and suits in Figure 2 (J = 0, Q = 4, K = 8, A = 12; ♣ = 1, ♦ = 2, ♥ = 3, ♠ = 4), you get a magic square with sums equal to 34 (e.g., 16+11+6+1 = 34; 16+5+3+10 = 34). For this square, even the diagonals sum to 34, as do the four corners, the center four cells, and each set of four cells anchored by a corner (e.g., 16+11+5+2 = 34; 9+14+4+7 = 34)—lots of magic in this square.
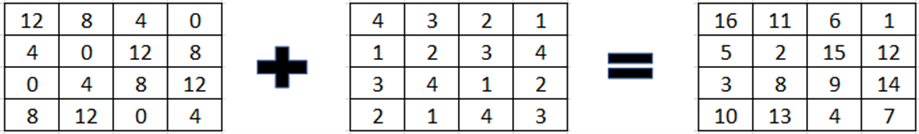
Figure 4: Combining orthogonal squares to create a magic square.
Euler’s fascination with magic squares came somewhat late, as amulets featuring magic squares and other Greco-Latin squares predate Euler by 700 years (Andersen, 2007 [PDF]).
The Physical Application of Latin and Greco-Latin Squares to Experimental Design
Next, we move from magic and pure math to agriculture in the early 20th century. In 1919, R. A. Fisher began working at the Rothamsted Experimental Station in England to reanalyze agricultural data collected since 1843 and to improve their methods for future agricultural research. While there, he began working out the mathematics of ANOVA and modern methods of experimental design. The F-test—the test used to assess the statistical significance of ANOVA results—was named in honor of Fisher (Cowles, 1989).
One of Fisher’s breakthroughs, promoted in his classic book, The Design of Experiments, was the realization that he could take a pattern similar to the cards shown in Figure 2 and use that to control nuisance variables when conducting field experiments with crops. For example, if a field of crops had variations in soil composition, then a Greco-Latin square could be used to systematically vary two independent variables of interest—say, amount of water and amount of fertilizer. This counterbalances (cancels out) any effects due to differences in soil composition. This was such an important innovation that the cover of Fisher’s The Design of Experiments illustrates a Latin square using colors as symbols (Figure 5). Every color appears in each row and column exactly once. By using colors instead of letters, the illustration looked very much like the fields on which Fisher conducted his agricultural experiments.
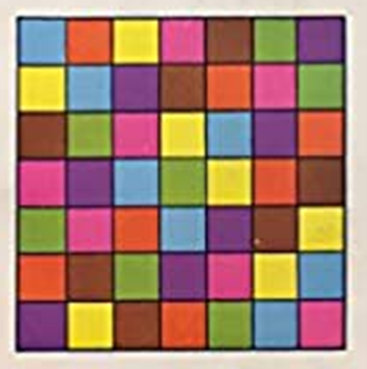
Figure 5: Illustration of a Latin square from the cover of R. A. Fisher’s The Design of Experiments.
From Agriculture to Psychology
It takes time for innovations in one research domain to be adopted by others. One of the earliest uses of a Latin square in psychological research was a study of different methods for administering spelling tests in the British Journal of Educational Psychology (Nisbet, 1939). By the 1940s, several papers had been published advocating the use of Latin squares in psychology experiments, especially to control for nuisance variables in within-subjects experiments associated with time-related effects such as practice and fatigue (Richardson, 2018 [PDF]).
In addition to pure experimental psychology, Latin and Greco-Latin designs have been used in human factors engineering, human-computer interaction, and UX research—though perhaps not as frequently as they should, given their efficiency. Researchers who conduct these types of studies with human participants do need to be cautious regarding the possibility of asymmetric transfer effects from one experimental condition to another, but this is something that can be checked after the data have been collected.
Using Greco-Latin Squares in UX Research
Combining small Greco-Latin squares into a Greco-Latin rectangle
We recently conducted an experiment comparing UMUX-Lite ratings in which we systematically varied the formats of the response options of the two UMUX-Lite items to compare numbers with face emojis (Figure 6) using our MUIQ platform.


Figure 6: Numeric and face emoji versions of the UMUX-Lite.
To design that experiment, we used several 2×2 squares to create a Greco-Latin rectangle that had the counterbalanced structure illustrated in Figure 7. This experimental design balanced the order of presentation of formats (numbers or emojis), contexts (R = rating the most recent experience with a streaming entertainment service provider; O = rating the overall experience with the provider), and the pairing of formats and contexts. Participants were randomly assigned to one of the four orders formed by the crossing of Item Format, Rating Context, and Order of Presentation. Across the experiment, this controlled for the “nuisance” variables of Rating Context and Order of Presentation.

Figure 7: Combining multiple small Latin squares to get a Greco-Latin rectangle.
With this design, we were able to detect significant differences among the ratings of various service providers and also demonstrated that any differences caused by response option formats were not statistically significant. The mean difference between numeric and emoji ratings was half a point, which is very small for a measure that can range from 0 to 100 points (95% confidence interval ranged from -0.6 to 1.5).
In addition to the experiments we conduct for ourselves, we also use this study design for client projects when we need to efficiently control nuisance variables and want the enhanced precision of a within-subjects design.
Consequences of failing to counterbalance in within-subjects research
In the introduction to this article, we posed a question: If you give participants two versions of a rating scale always in the same order, how can you tell whether significant differences in ratings are due to the different formats or to how people respond to repeated administrations of a survey?
This question isn’t hypothetical. In a review we conducted in 2010, the literature for the “left-side bias” seemed to suggest that survey respondents were slightly more likely to choose whichever response option was presented first (on the left) and that this practice could be used to manipulate research outcomes. We recently revisited that literature and found that researchers in several published studies didn’t counterbalance the order of presentation of item formats.
When properly balanced, the evidence revealed a tendency for the second administration of these types of surveys to score lower than the first, even when people completed the same questionnaire both times. This “second-administration” effect appears to have amplified the magnitude of apparent left-side biases when the experimental design was within-subjects but lacking proper counterbalancing. When the researchers exercised proper control, the average difference between item formats was less than 1%.
Summary and Takeaways
Latin squares are grids of letters arranged so that each letter appears just once in each row and column. Greco-Latin squares are created through the combination of two mutually orthogonal Latin squares (MOLS).
People have been fascinated with these arrangements for a millennium. They appear on amulets and other artifacts from a thousand years ago when they were believed to have magical properties. They were the basis for card puzzles in the 1700s when they attracted the attention of the mathematician Leonhard Euler. In Euler’s mathematical writings on MOLS, he would use Latin letters in one square and Greek letters in the other. Mathematicians who built on his work called the combined squares Greco-Latin. When they worked with single squares, they preferred Latin letters, so the modern convention is to refer to individual squares as Latin squares.
In the 1920s, R. A. Fisher worked out statistical methods for using Latin and Greco-Latin squares in agricultural research, taking the abstract layouts and using those patterns in experiments with crop fields to counterbalance nuisance variables, such as soil composition, across the variables of interest (e.g., amount of water, amount of fertilizer, etc.).
By the 1940s, psychologists had adopted Latin squares to control for nuisance variables such as fatigue and practice in within-subjects experimental designs. They introduced these designs into the fields of human factors, human-computer design, and UX research, where they’re still used today.