 One of the best ways to make UX metrics more meaningful is to have a comparison. For example, when conducting a UX benchmark study we often recommend adding at least one competing product (especially if it’s the first benchmark).
Comparable interfaces help stakeholders easily interpret context-sensitive task metrics, such as completion rates and task time. While attitudinal measures such as the SEQ and SUS have been standardized against a normed-group, seeing how the competition scores in the same contexts is helpful.
However, if you’re planning to have a comparison in a study, the next key decision concerns whether participants will experience just one interface or all interfaces you want to compare.
The technical term for an experiment in which participants experience just one condition (e.g., interface, product, etc.) is between-subjects (maintaining the somewhat outdated 20th-century term “subjects” for participants). Experiments in which participants experience all conditions are within-subjects.
We covered the strengths and weaknesses of both designs in an earlier article, summarized in Table 1.
| Factor to Consider | Between | Within |
|---|---|---|
| Sample Size and Power | - | + |
| Carryover Effects | + | - |
| Impact on Attitudes | + | - |
| Comparative Judgement | - | + |
| Study Duration | + | - |
Table 1: Factors to consider when choosing between- or within-subjects experimental designs.
As shown in Table 1, the primary advantages of within-subjects designs are
- Sample Size and Power: Within-subjects studies have increased sensitivity due to participants acting as their own controls, which has the practical effect of requiring substantially fewer participants to get the same level of precision as an otherwise identical between-subjects experiment.
- Comparative Judgment: You can ask participants which condition they preferred because they experienced all of them.
The primary disadvantages of within-subjects designs are
- Carryover: Carryover (transfer) effects, such as an initial task teaching a user to better complete later tasks, can confound scores.
- Study Duration: Having participants work through all experimental conditions rather than just one results in longer study durations, which can limit the number of tasks participants can attempt.
- Impact on Attitudes: There may be an impact on a participant’s comparative judgment, causing a specific type of carryover effect in which the participant’s knowledge of previous ratings affects the magnitude of later ratings.
Managing Carryover Effects
Of the disadvantages of within-subjects designs, the potential for carryover effects usually concerns researchers the most. For example, how do we know that better metrics weren’t just a result of a participant having already completed a task on the competing interface? Or conversely, were lower metrics caused by participants just getting tired of attempting many tasks after already spending 30 minutes with the competing product?
The common practice to mitigate carryover effects in within-studies is to counterbalance the presentation order using Latin or Greco-Latin designs and randomly assign participants to one of the orders.
Across an entire experiment, this scrambling of the order usually reduces the influence of carryover effects. This way, unwanted learning or fatigue effects should impact both interfaces roughly equally, and the effect should cancel out. But this canceling out happens only if the magnitudes of the carryover effects are close to symmetrical.
That is, if one interface has a larger learning effect than another, or is maybe much harder, there’s a chance the carryover effects won’t cancel out, disproportionately impacting the metrics on one interface. It could be that one experience is acting as an anchor affecting the other interfaces.
Anchoring, when it occurs, is a cognitive bias (first described by the behavioral economists Kahneman and Tversky) where an initial number held in memory exerts a mental “pull” on subsequent numbers that come to mind. How much does asymmetry, particularly for attitudinal measures, happen in UX research? Should we be concerned about using within-subjects studies?
Detection of Asymmetric Transfer Due to Anchoring Effects
Cockburn and Gutwin (2019) [PDF]) reviewed four previously published within-subjects experiments (n = 36, 28, 10, and 16) that included ratings with the six-item NASA-TLX. They reported evidence of asymmetric transfer in 42% of tests conducted at the item level (10 of 24 tests) and that the pattern of asymmetric transfer was consistent with anchoring effects.
All studies had two independent variables: Interface (A and B) and order of presentation (A1B2 and B1A2). Cockburn and Gutwin estimated asymmetric transfer by comparing the combined means of A1B2 with B1A2.
For example, suppose you’re using a five-point ease scale, and the true scores for A and B are, respectively, 2 and 4. Also, suppose there are anchoring effects, but the effects are the same and equal to a “pull” of 1 point (25% of the range of the scale). Figure 1 shows the pattern of these hypothetical results.
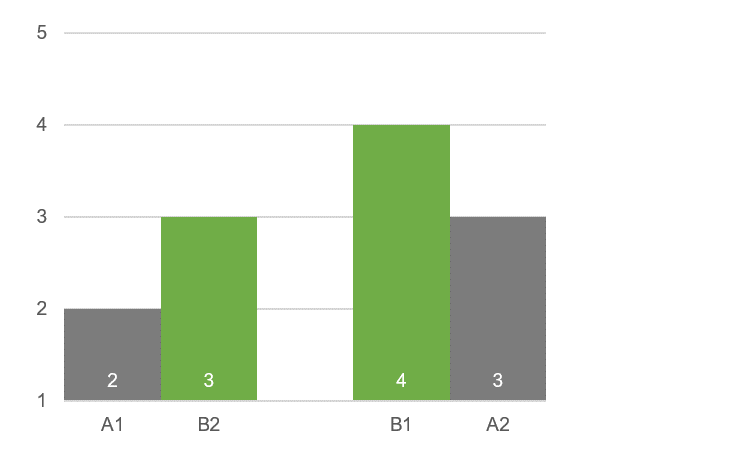
Figure 1: Hypothetical example of symmetric transfer due to anchoring.
A1 and B1 are the conditions that participants encounter first, so they correspond to the “true” perceived ease of the interfaces (no carryover). In this example, they differ by two points (50% of the range of the scale).
For the order A1B2, the anchoring effect drags the rating of B down by one point. For the order B1A2, the anchoring effect lifts the rating of A by one point. Using the logic of Cockburn and Gutwin (2019), there is evidence of asymmetric transfer because the mean of A1B2 (2.5) is different from the mean of B1A2 (3.5), even though the magnitude of pull due to anchoring was the same for A1B2 as it was for B1A2.
Furthermore, the difference between the overall averages of A and B collapsed across orders is just 1.0 (25% of the range of the scale), even though the difference between A1 and B2 was 2.0 (50% of the range of the scale). Cockburn and Gutwin argue that this “gap widening”—when the difference for between-subjects means is greater than for within-subjects means—is an expected pattern when asymmetric transfer is due to anchoring.
Our Experience with Within-Subjects Effects
When we read the Cockburn and Gutwin (2019) paper, we were surprised by the results. Based on our experience, we expected a stronger crossover effect in which a within-subjects comparison of two products would amplify rather than diminish the difference between their means—more of a polarization effect—which is the opposite of what you’d expect if anchoring was affecting ratings.
For example, we have seen exaggerated ratings in within-subjects designs. If you give participants one relatively mediocre design (or website) and one really bad design (or website), participants tend to rate the mediocre design much higher than if it were rated in isolation. They also tend to rate the lesser of the designs as much worse.
We saw this effect when we did a within-subjects benchmark of enterprise.com and budget.com. Budget scored much higher than Enterprise on both objective metrics (such as completion rates) and subjective metrics (such as the SUPR-Q). When we tested both sites in isolation (using a between-subjects approach), Budget and Enterprise had similar scores. Although we occasionally conduct within-subjects studies when we want to directly collect preference data, experiences like this have led us to prefer between-subjects designs for benchmarking.
Two Recent Within-Subjects Experiments: Comparison of Numeric Ratings with Slider and Star Scales
We have recently written about two within-subjects studies we conducted to compare the magnitudes of ratings between linear numeric scales and two types of graphic scales (slider or star). We set up a Greco-Latin experimental design to support a within-subjects comparison of UMUX-Lite ratings of a variety of streaming entertainment services (335 participants sampled from a US panel agency rated streaming entertainment services such as Netflix, HBO Now, Amazon Prime Video, Hulu, and Disney+ in May–June 2020).
With this design, there were three independent variables:
- Item Format (linear numeric vs. sliders in the first study; linear numeric vs. stars in the second study)
- Rating Context (rating of most recent experience with the service; rating of the overall experience with the service—we were not interested in this comparison but needed variation in the “task” to avoid asking participants to rate exactly the same thing with two scales)
- Order of Presentation (numeric/recent then graphic/overall; numeric/overall then graphic/recent; graphic/recent then numeric/overall; graphic/overall then numeric/recent)
Participants were randomly assigned to one of the four orders formed by the crossing of Item Format, Rating Context, and Order of Presentation. Across the experiment, this controls for the “nuisance” variables of Rating Context and Order of Presentation. But if anchoring effects were in play, averaging item format scores over orders of presentation might have attenuated our estimate of the effect of Item Format. Figure 2 shows the results using the format from Figure 1.

Figure 2: Results from two within-subjects experiments of differences in ratings due to Item Format.
Although the nominal patterns in Figure 2 could be consistent with anchoring effects, the first check is whether there is compelling evidence of asymmetric transfer using statistical tests that compare the means for the two orders of presentation collapsed over item format. For the sliders experiment, the test was not significant (t(178) = 1.1, p = 0.29). It was also not significant for the stars experiment (t(153) = 1.2, p = 0.26). Given these results, there’s no point in continuing analysis of anchoring.
Regarding estimates of the differences between numeric and graphic scales in these experiments, for the within-subjects analyses we calculated the following differences and associated 95% confidence intervals:
- Sliders experiment: d = 0.6, 95% confidence interval ranged from -0.7 to 2.0 (width = 2.7)
- Stars experiment: d = 1.3, confidence interval ranged from -2.6 to 0.1 (width = 2.7)
Switching to between-subjects analysis of participants’ first ratings, the estimates of differences and confidence intervals were
- Sliders experiment: d = 2.3, 95% confidence interval ranged from -2.8 to 6.3 (width = 9.1)
- Stars experiment: d = 3.0, 95% confidence interval ranged from -1.7 to 7.8 (width = 9.5)
For both within- and between-subjects analyses, the observed differences were small and not statistically significant, even with fairly large sample sizes. Examination of the confidence intervals indicates it’s plausible that all differences could be 0.
The point estimates of observed differences were larger for between-subjects analyses. It’s hard to say whether this is the same as the gap widening reported by Cockburn and Gutwin (2019) in the apparent presence of anchoring, because the confidence intervals from the between-subjects analyses are so much wider than those from the within-subject analyses (as expected), and for these experiments, there was no significant evidence of asymmetric transfer.
Summary and Takeaways
It’s too early to declare that results from within-subjects experiments that include subjective measures are invalid. It’s not too early, however, for researchers who use within-subjects designs to check for asymmetric transfer and to be aware of the possible effect of anchoring or polarization on repeated subjective measurements.
Researchers who find evidence of asymmetric transfer can pull back from the within-subjects design and just compare the first conditions that participants experience using analyses appropriate for a between-subjects design. As shown in the confidence intervals from our recent experiments, though, this can lead to a substantial loss of precision.
It’s an open research question as to which tends to have a larger effect in within-subjects UX studies: anchoring (which pulls within-subjects ratings closer) or polarization (which pushes within-subjects ratings apart).
[Slightly updated 9/13/2020]