 Are people more likely to select response options that are on the left side of a rating scale?
About ten years ago, we provided a brief literature review of the published evidence, which suggested that this so-called left-side bias not only existed but also was detected almost 100 years ago in some of the earliest rating scales.
Across the publications we reviewed, the effect size seemed to be about 7.5% of the total possible range of the items used to measure the bias, leading to the claim that “an unethical researcher interested in manipulating results could place the desired response on the left side of the scale” (Friedman & Amoo, 1999, p. 117).
This didn’t seem unreasonable given theories on participant motivation, reading habits, and education level, which operated in conjunction with a primacy effect that was consistent with the observed bias. For ten years this was our understanding of the left-side bias.
But after a UX metrics study conducted by Jim in 2019 found little evidence for a left-side bias (just a nonsignificant 1% difference), we wondered how robust the left-side bias really was.
Could other variables account for the lack of effect in the new study? Was it the study design or something about the UX measures? Or was there more (or less) to the earlier papers than their titles and abstracts suggested?
The only way to find out was to revisit the published papers from the original literature review and to check the quality of their data and citations. This took us on a journey through six papers published over the course of 90 years.
Wait a Second … Where’s the Left-Side Bias?
In the 2019 study, 546 IBM employees rated IBM Notes using a version of the Technology Acceptance Model (TAM). Participants were randomly assigned to complete a TAM questionnaire with item scales oriented from either left to right (Figure 1, top) or right to left (Figure 1, bottom).
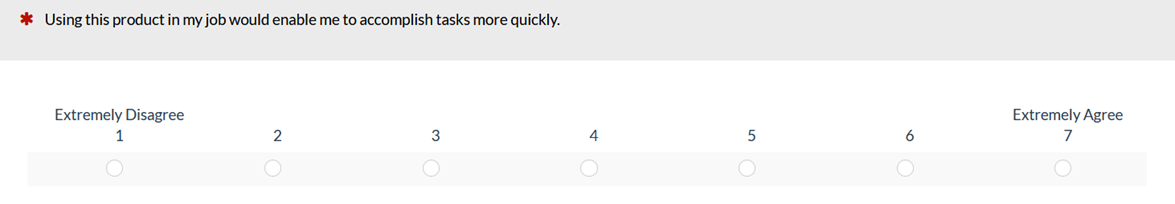
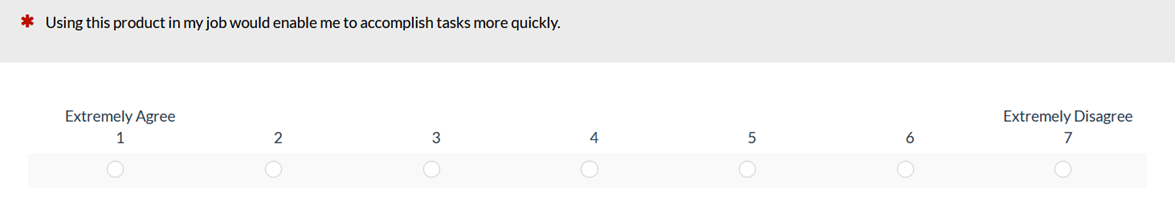
Figure 1: Left to right (top) and right to left (bottom) scale formats used in Lewis (2019).
Both formats of the TAM had 12 items that were averaged and converted to 0–100-point scales. The results were consistent with a left-side bias (Figure 2 slightly higher mean for R to L). However, the difference was smaller than expected (just 1% of the scale’s range) and not statistically significant (F(1, 542) = .16, p = .69). A 95% confidence interval around the mean difference of 1 ranged from -3.9 to 5.8, so if the nominal difference of 1 is a real difference, it would take a sample size much larger than 546 to prove it.
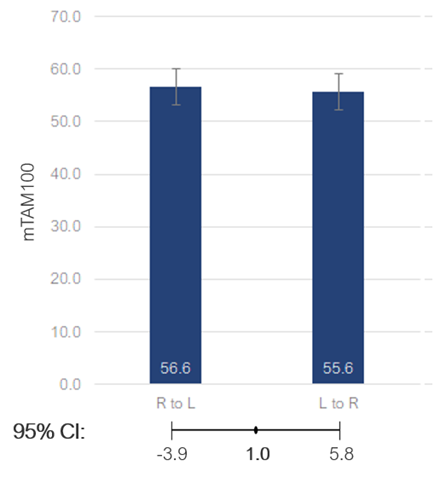
Figure 2: Comparison of means as a function of format from Lewis (2019).
With this result in mind, we revisited the literature and tracked down earlier papers (and possibly the earliest) on this topic. The papers we reviewed follow two research threads:
- Personal Distress Scale
- Rating of educational experiences
Left-Side Bias in the Personal Distress Scale
Evidence Supporting the Left-Side Bias
Chan (1991) conducted a study using five items from the Personal Distress Scale of the Interpersonal Reactivity Index, translated into Mandarin, with 102 students from two senior high schools in Taipei participating. The items used five-point Likert-type response scales, as shown in Figure 3. There were two versions of the items. Version 1 (top of Figure 3) had response labels from positive on the left to negative on the right. Version 2 (bottom of Figure 3) had response labels from negative on the left to positive on the right. In the first administration of the survey, all participants completed Version 1. Five weeks later they completed Version 2. In the abstract, he reported “It was proposed that subjects tended to choose the first alternative acceptable to them from among the ordered response categories so that a primary effect was predicted. Findings supported the hypothesis.” In reviewing this paper, we wanted to know the magnitude of the reported effect and whether any aspects of the experimental design might have contributed to the effect.
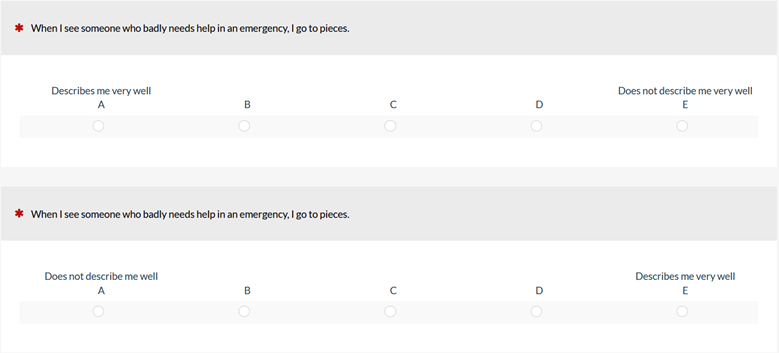
Figure 3: Sample item from the Personal Distress Scale (top: Version 1; bottom: Version 2).
Chan reported higher means for four of the five items for Version 1, the positive-first response order. A multivariate test of all five items indicated a significant difference between the versions. Of four univariate tests, two were significant, one was marginal, and one was not significant. He did not publish the mean differences, either by item or overall, so we can’t assess the effect size.
There were several alternative explanations for the apparent left-side bias. Because the study was conducted with teenage students in Taipei, there were potential cultural effects. The biggest problem, though, is that this was a within-subjects study without counterbalancing, so we don’t know whether the reported differences were due to scale format, order of presentation, or some combination of the two.
Bottom Line: We don’t know whether the left-side bias here was simply because they didn’t alternate the presentation order of the scales and respondents just scored lower on the second version/presentation.
Evidence against the Left-Side Bias
Almost ten years later, Weng and Cheng (2000) replicated Chan’s study, but with experimental protocols in place to control the order of presentation. The total sample was 858 students: 490 from a university in Taipei and 368 from a junior high school in Taitung. Participants completed the same surveys as those administered in Chan. Two five-item surveys were given one week apart, but the order of presentation was completely balanced, with the results shown in Table 1. The means ranged from 6.59 to 8.69; the scores were the sums of five-item ratings (0–4), for a combined score that could range from 0 to 20.
| Education | Order | N | Mean 1 | Mean 2 | d | % Range | SD 1 | SD 2 |
|---|---|---|---|---|---|---|---|---|
| University | Neg-Neg | 93 | 8.58 | 7.24 | 1.34 | 6.7% | 3.58 | 3.48 |
| Neg-Pos | 184 | 8.09 | 7.36 | 0.73 | 3.6% | 3.72 | 3.57 | |
| Pos-Neg | 104 | 8.31 | 7.67 | 0.64 | 3.2% | 3.01 | 4.31 | |
| Pos-Pos | 109 | 7.84 | 6.66 | 1.17 | 5.9% | 3.76 | 3.96 | |
| Jr. High | Neg-Neg | 78 | 8.26 | 8.69 | -0.44 | -2.2% | 3.85 | 4.42 |
| Neg-Pos | 105 | 7.85 | 6.95 | 0.90 | 4.5% | 3.65 | 3.70 | |
| Pos-Neg | 83 | 7.30 | 7.31 | -0.01 | -0.1% | 3.57 | 3.91 | |
| Pos-Pos | 102 | 7.48 | 6.59 | 0.89 | 4.5% | 3.33 | 3.65 |
Table 1: Results from Weng and Cheng (2000), d = mean difference, % Range = d/20.
Surprisingly, the largest effect sizes were when university students received the same version on both administrations (6.7% and 5.9%).
When replicating Chan’s conditions (Pos–Neg), Weng and Cheng reported similar results for university students (a higher mean on first administration). However, the means were nearly identical for the junior high students.
Collapsing over all eight conditions, the mean effect size (% Range) was 3.3%, apparently due to a tendency for most groups to provide lower scores on the second administration regardless of the manipulation of item format.
Table 2 shows the results for the conditions where students completed two different forms. Pos–Neg is the mean of the two Pos–Neg groups, and Neg–Pos is the mean of the two Neg–Pos groups. If there was a left-side bias, the effect size for Pos–Neg should be larger than the one for Neg–Pos, but it clearly isn’t.
| Condition | D | % Range |
|---|---|---|
| Pos-Neg | 0.31 | 1.6% |
| Neg-Pos | 0.81 | 4.1% |
Table 2: Overall results from Weng and Cheng (2000).
Bottom Line: If anything, these data suggest (but don’t prove) a right-side bias of 2.5% (4.1%–1.6%).
Left-Side Bias in Ratings of Educational Experiences
In their review article, Rating the Rating Scales, Friedman and Amoo (1999) included a section on order effects in rating scales in which they concluded that the left-side bias was real and strong enough for unethical researchers to use it to manipulate results. Two of the papers they cited as providing evidence for this claim were Mathews (1929) and Friedman, Herskovitz, and Pollack (1994).
Evidence Suggesting (But Not Proving) a Weak Left-Side Bias
In Friedman et al. (1994 [PDF]), college students (n = 208) provided ten ratings of their school evenly split between two response formats in a between-subjects study; 104 with Strongly Agree on the left (SA/SD) and 104 with Strongly Agree on the right (SD/SA). They scored Strongly Agree as a 1 and Strongly Disagree as a 5, so if there was a left-side bias, you’d expect higher scores when Strongly Disagree was on the left. Table 3 shows the results.
| Item | SA/SD | SD/SA | D | % Range | sd SA/SD | sd SD/SA |
|---|---|---|---|---|---|---|
| 1 | 3.57 | 3.64 | 0.07 | 1.8% | 0.90 | 0.94 |
| 2* | 2.10 | 2.31 | 0.21 | 5.3% | 0.60 | 0.75 |
| 3* | 2.14 | 2.42 | 0.28 | 7.0% | 0.78 | 0.95 |
| 4 | 2.50 | 2.55 | 0.05 | 1.3% | 0.78 | 0.70 |
| 5 | 3.72 | 3.58 | -0.14 | -3.5% | 0.91 | 0.88 |
| 6 | 3.69 | 3.78 | 0.09 | 2.3% | 0.88 | 0.89 |
| 7* | 2.20 | 2.54 | 0.34 | 8.5% | 0.82 | 1.00 |
| 8 | 2.70 | 2.87 | 0.17 | 4.3% | 0.92 | 1.12 |
| 9 | 3.47 | 3.36 | -0.11 | -2.8% | 0.91 | 0.98 |
| 10 | 4.28 | 4.13 | -0.15 | -3.8% | 0.63 | 0.78 |
Table 3: Results from Friedman et al. (1994), * = significant p < .05.
The three items with asterisks are those for which the mean differences were statistically significant. Friedman et al. (1994) focused on these items in their discussion to support a claim of a left-side bias. But what about the other seven items? If you average across items to use all the available data, the average difference is .08 on a five-point scale. After rescaling to 0–4, this translates to 2% of the range of the scale (0.8/4, nonsignificant across items; t(9) = 1.5, p = .17).
Bottom Line: After considering all ten items, these results suggest a small left-side bias, but it’s not proven.
More Evidence Suggesting (But Not Proving) a Weak Left-Side Bias
Mathews (1929) is particularly interesting because it’s the oldest investigation of the left-side bias, cited by Chan, Friedman et al., and Weng and Cheng. Mathews reported two studies, both of which had students complete a 50-item Likert-type questionnaire (even though this predates Likert’s published works on scales).
In Study 1, Mathews used a counterbalanced experimental design (n = 184) in which half of the students in the sample got Form A (strong positive on left) and the other half got Form B (strong negative on left). Later in the same class session, he had them complete the questionnaire again, but with the other form.
In Study 2 (n = 130) he used the same questionnaire, but gave all students Form A first; then, a week later, gave them all Form B—the same confounding experimental design as Chan.
The data in Tables 1 and 2 of the paper show the total numbers of responses for each response option, summed over items and students. It looks like Mathews conducted something like a z test to compare the percentages for each response option in each study, claiming some significant differences, but it seems he used the sum of all the responses (50 items times the number of students—almost 9,200 in Study 1 and almost 6,500 in Study 2) as the denominator rather than restricting the denominator to the number of students and adjusting the numerator accordingly.
From the data presented, it’s possible to reconstruct how many students tended to give each response option by dividing the numbers in the response option columns by 50 (the number of items). It’s not possible, however, to set up a within-subjects analysis of the mean difference because the paper doesn’t show which student gave which responses. Keeping that limitation in mind, Figure 4 shows a graph of the mean scores for both studies (transformed to a 101-point scale) so we can see the overall mean differences equivalent to percentages. For these data, a larger mean for Form A is consistent with a left-side bias.
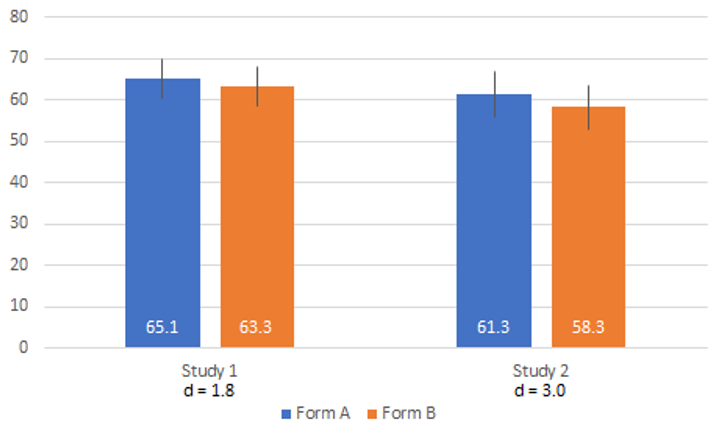
Figure 4: Mean differences from Mathews (1929).
For Study 1, the difference was 1.8%; for Study 2, it was 3.0%. Due to the confounding in Study 2, however, we can’t take that difference at face value, since it’s similar to the pattern in other studies where the mean is lower on the second administration regardless of item manipulation (e.g., Weng & Cheng). The results of Study 1 are consistent with a left-side bias, but a small one that doesn’t appear to be statistically significant (note the substantial overlap of the 95% confidence intervals).
Bottom Line: These results suggest a small left-side bias, but it’s not proven.
Summary and Takeaways
We revisited our earlier review of the left-side bias because the results of Lewis (2019), while slightly consistent with a left-side bias, were much smaller than expected. Sometimes you need to re-read some papers and go deep to understand how to reconcile differences in findings.
Out of the six studies we reviewed, four reported credible effect sizes for a bias. Three were consistent with a left-side bias (Lewis, 1%; Friedman et al., 2%; Mathews, 1.8%), and one was consistent with a right-side bias (Weng & Cheng, 2.5%). Thus, the average estimate of the left-side bias across these four studies is 0.6%.
Given the variation in participants in the various studies (adults and teenagers, U.S. and Taiwanese), it doesn’t seem likely that results were driven by maturation or cultural effects.
It does seem possible that there is a tendency for the second administration of these types of surveys to score lower than the first, and this effect amplified the magnitude of apparent left-side biases when the experimental design was within-subjects without proper counterbalancing.
It does not seem plausible that the left-side bias, if it exists, is of sufficient magnitude for unethical researchers to use it to manipulate results.