 Somewhat agree, very satisfied, extremely likely.
The labels used on the points of rating scales can affect responses in often unpredictable ways.
What’s more, certain terms can get lost in translation when writing surveys for international usage. Some terms may have subtly different meanings, possibly making cross-cultural comparisons problematic.
While numbers are universally understood and don’t need translation, does “5” on a seven-point scale properly capture the right sentiment from respondents?
Instead of using labels and numbers, an alternative is to use facial expressions to convey a sentiment. After all, human facial expressions are, for the most part, universally understood. Using facial expressions might remove the need for translation (assuming different cultures interpret the faces similarly).
Emojis are simple representations of facial expressions, and we expect people who are answering the questionnaire to have an understanding of emotions represented by faces, simple as they are.
So, how well do emojis perform compared to traditional numeric labels? First, let’s review some of our recent findings for similar, but less extreme, manipulations of item formats.
We recently reported comparisons of UMUX-Lite data collected of standard five-point linear numeric scales with 0–100-point slider scales and five-star ratings. Despite major differences in the scale formats, we found very small, nonsignificant differences.
In fact, finding small differences between different formats is not the exception. It’s usually what we find when we test different item formats. That’s why we don’t get too bent out of shape when we see variations in standard formats.
We do, however, occasionally discover meaningful differences in measurement quality (e.g., evidence that having just three response options in single rating scales is markedly insufficient for accurately capturing attitudes and sentiments). However, such discoveries are rare compared to studies that find no significant differences due to item formats in the context of UX research.
Continuing this line of research, we recently collected a set of data for the comparison of standard five-point numeric scales and graphic scales with face emojis.
What Are Face Emoji Scales?
Figures 1 and 2 show examples of five-option numeric and face emoji versions of the UMUX-Lite. Although it is an item-design option, we chose to not show numbers with emoji faces.
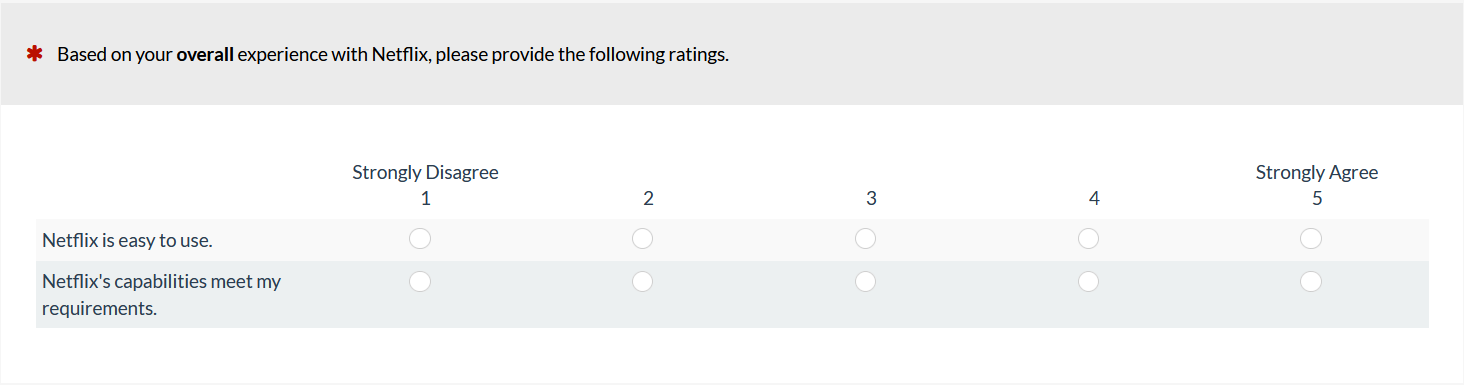
Figure 1: Example of a linear numeric version of the UMUX-Lite (created with MUIQ).

Figure 2: Example of a face emoji scale version of the UMUX-Lite with expressions created through manipulations of the mouth and eyes (created with MUIQ).
There has been quite a bit of research conducted with face emoji scales, especially in consumer research. For example, the K-State emoji scale (seven response options arranged from negative to positive valence) has been used to obtain emotional responses to products, especially with children.
Alismail and Zhang (2018) conducted a qualitative study of reactions to emoji scales similar to the one shown in Figure 2. Participants indicated that emoji scales were easy to understand and engaging, but emojis were sometimes prone to multiple interpretations, suggesting they were not as universally understood as human facial expressions.
It isn’t clear from the existing research whether it would be advantageous for UX researchers to use face emojis for response options in agreement scales (Figure 2) rather than the standard numbering scheme (Figure 1). To learn more, we ran an experiment to see whether these format differences affected measurements made with a short standardized UX questionnaire, the UMUX-Lite.
Face Emojis vs. Numbers Experiment
Continuing our interest in how variation in item format affects measurement of the user experience, we set up a Greco-Latin experimental design to support a within-subjects comparison of UMUX-Lite ratings.
Our 240 participants, sampled in August 2020 from a U.S. panel agency, rated a variety of streaming entertainment services: Netflix, AT&T TV Now, Amazon Prime Video, Hulu, YouTube TV, or Disney+. (For detailed information about UX metrics and comparisons among popular video streaming entertainment websites and apps, see our recent article and report).
In this design, there were three independent variables:
- Item Format (linear numeric, face emojis—see Figures 1 and 2)
- Rating Context (rating of most recent experience with the service; rating of the overall experience with the service)
- Order of Presentation (numeric/recent then emojis/overall; numeric/overall then emojis/recent; emojis/recent then numeric/overall; emojis/overall then numeric/recent)
Participants were randomly assigned to one of the four orders formed by the crossing of Item Format, Rating Context, and Order of Presentation. Across the experiment, this controls for the “nuisance” variables of Rating Context and Order of Presentation. (In addition to the experiments we conduct for ourselves, we also use this study design for client projects when we need to efficiently control nuisance variables and want the enhanced precision of a within-subjects design.)
Results
We combined and converted the five-point responses for both versions of the UMUX-Lite to their standard 0–100-point scale and collapsed the data across all streaming services. The difference in mean scores for the 240 responses was quite small at a half-point (0.5%) difference, which was not statistically significant (Figure 3).
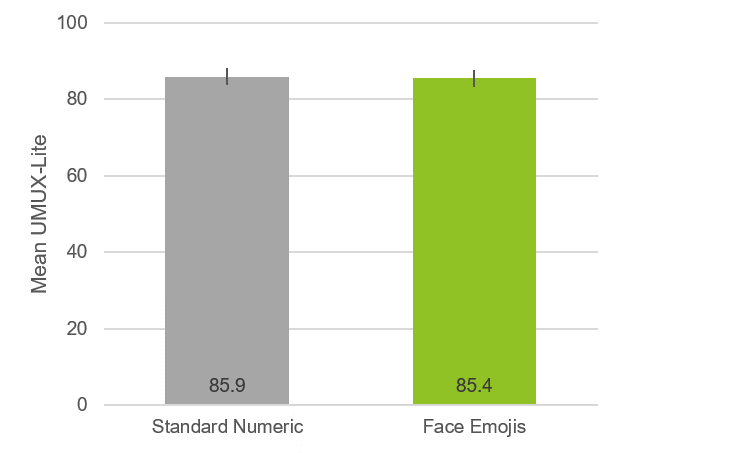
Figure 3: Overall difference between UMUX-Lite means for numeric and face emoji scales (error bars are 95% confidence intervals with a margin of error of ±2.2).
An ANOVA indicated no significant main effects or interactions (all p > .17 with 236 error df). Because the main effect of order was not significant (F(1, 236) = 1.86, p = .17), there is no compelling evidence of an anchoring effect distorting these ratings.
A 95% confidence interval around the observed difference of 0.5 ranged from -0.6 to 1.5, so a difference of 0 is plausible, but any absolute difference exceeding 1.5 isn’t plausible.
There is no external benchmark for determining which of the means is “correct,” but the confidence interval shows that all plausible differences are relatively small given the full range of the UMUX-Lite (0 to 100 points).
We also checked the distribution of responses for the five-point items to see whether there were any radical differences. As shown in Figures 4 and 5, the distributions were very similar for standard numbers and the face emojis for both Ease and Usefulness (“meets requirements”) items, even though the face emojis had no numbers attached to them.
Note that these results are specific to these face emojis for one question type about one type of experience (streaming services). We would expect the results to generalize to similar sets, but it’s always possible that there might be sets with extreme enough expressions to affect the distribution of response options, much in the same way that manipulation of the wording of items in the System Usability Scale doesn’t have a strong effect on the resulting measurements unless the item manipulation is extreme (e.g., changing the wording of Item 10 from “I needed to learn a lot of things before I could get going with the system” to “I think that I would need a permanent hot-line to the help desk to be able to use the website”).

Figure 4: Response distributions for the Ease item (with 90% confidence intervals).
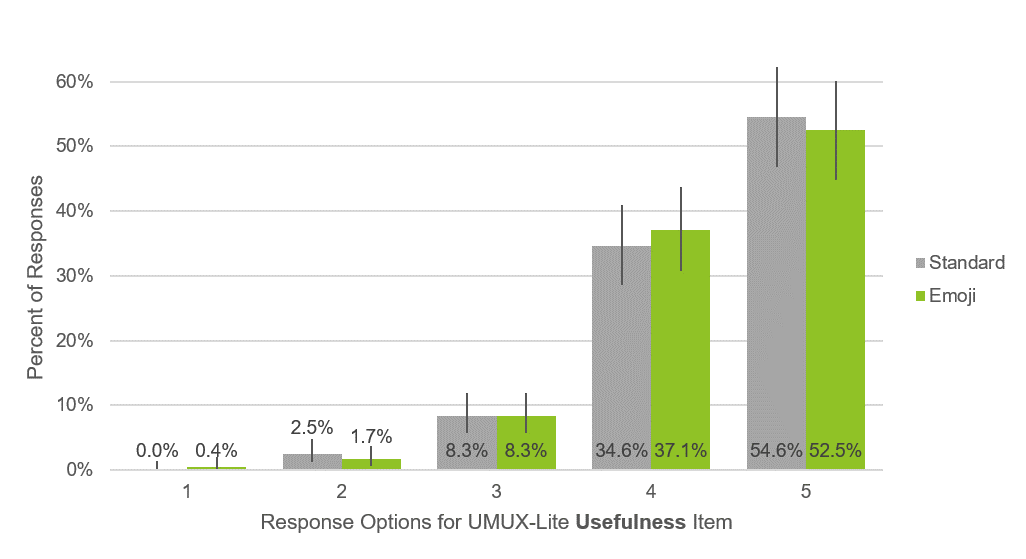
Figure 5: Response distributions for the Usefulness item (with 90% confidence intervals).
Summary and Takeaways
Emojis offer an alternative to labels that may be easier for people to respond to, and they don’t need to be translated.
In this experiment, however, we found no significant differences or interactions between mean UMUX-Lite ratings collected with standard linear numeric scales and face emoji scales.
We also saw no significant differences in the distributions of responses to the different versions of the Ease and Usefulness items, even though we presented the face emojis without numbers.
The overall observed difference (0.5) was similar to the difference we found in similar experiments comparing numeric with slider scales (0.2) and star scales (1.3). Differences in all cases were small relative to the full range of the UMUX-Lite (0 to 100 points).
These results support the use of either format, standard or emoji, in UX research. Because there doesn’t appear to be any particular advantage in using face emoji scales, UX researchers should feel comfortable with standard linear numeric rating scales.
When data demonstrate format equivalency, UX researchers can use standard formats without worrying that they’re somehow missing something important by not using the more exotic format. If someone in authority insists on an equivalent nonstandard format, UX researchers can use the equivalent format with confidence, saving their energy for the discussions that matter.