 No one likes getting lost. In real life or digitally.
One can get lost searching for a product to purchase, finding medical information, or clicking through a mobile app to post a social media status.
Each link, button, and menu leads to decisions. And each decision can result in a mistake, leading to wasted time, frustration, and often the inability to accomplish tasks.
But how do you measure when someone is lost? Is this captured already by standard usability metrics or is a more specialized metric needed? It helps to first think about how we measure usability.
Measuring Usability
We recommend a number of usability measures to assess the user experience, both objectively and subjectively (which come from the ISO 9241 standard of usability). Task completion, task time, and number of errors are the most common types of objective task-based measures. Errors take time to operationalize (“What is an error?”), while task completion and time can often be collected automatically (for example, in our MUIQ platform).
Perceived ease and confidence are two common task-based subjective measures—simply asking participants how easy or difficult or how confident they are they completed the task. Both tend to correlate (r ~ .5) with objective task measures [pdf]. But do any of these objective or subjective measures capture what it means to be lost?
What Does It Mean to Be Lost?
How do you know whether someone is lost? In real life you could simply ask them. But maybe people don’t want to admit they’re lost (you know, like us guys). Is there an objective way to determine lostness?
In the 1980s, as “hypertext” systems were being developed, a new dimension was added to information regarding behavior. Designers wanted to know whether people were getting lost when clicking all those links. Earlier, Elm and Woods (1985) argued that being lost was more than a feeling (no Boston pun intended); it was a degradation of performance that could be objectively measured. Inspired by this idea, in 1996 Patricia Smith sought to objectively define lostness and described a way to objectively measure when people were lost in hypertext. But not much has been done with it since (at least that we could find).
Smith’s work has received a bit of a resurgence after Tomer Sharon cited it in Validating Product Ideas and was consequently mentioned in online articles.
While there have been other methods for quantitatively assessing navigation, in this article we’ll take a closer look at how Smith quantified lostness and how the measure was validated.
A Lostness Measure
Smith proposed a few formulas to objectively assess lostness. The measure is essentially a function of what the user does (how many screens visited) relative to the most efficient path a user could take through a system. It requires first finding the minimum number of screens or steps it takes to accomplish a task—a happy path—and then comparing that to how many total screens and unique screens a user actually visits. She settled on the following formula using these three inputs to account for two dimensions of lostness:
N=Unique Pages Visited
S=Total Pages Visited
R=Minimum Number of Pages Required to Complete Task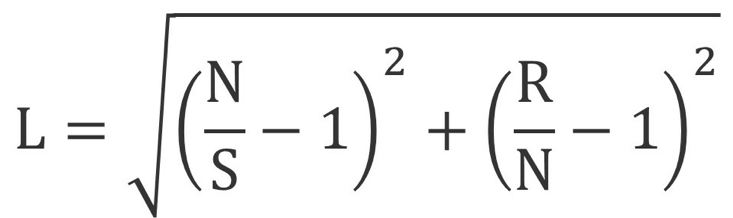
The lostness measure ranges from 0 (absence of lostness) to 1 (being completely lost). Formulas can be confusing and they sometimes obscure what’s being represented, so I’ve attempted to visualize this metric and show how it’s derived with the Pythagorean theorem in Figure 1 below. 
Figure 1: Visualization of the lostness measure. The orange lines with the “C” is an example of how a score from one participant can be converted into lostness using the Pythagorean theorem. Image updated 5/20/19 to show Method 2 derivation from Smith (1996) p 374.
Smith then looked to validate the lostness measure using data from a previous study using 20 students (16 and 17 year olds) from the UK. Participants were asked to look for information on a university department hypertext system. Measures collected included the total number of nodes (pages), deviations, and unique pages accessed.
After reviewing videos of the users across tasks, she found that her lostness measure did correspond to lost behavior. She identified the threshold of lostness scores above .5 as being lost, while scores below .4 as not lost, and the scores between .4 and .5 as indeterminate.
The measures were also used in another study that used eight participants with more nodes as reported in Smith. In the study by Cardle (a 1994 dissertation), similar findings of Lostness and Efficiency were found. But of the eight users, one had a score above .5 (indicating lost) when he was not really lost but exploring—suggesting a possible confound with the measure.
Replication Study
Given the small amount of data used to validate the lostness measure (and the dearth of information since), we conducted a new study to collect more data, to confirm thresholds of lostness, and see how this measure correlates with other widely used usability measures.
Between September and December 2018 we reviewed 73 videos of users attempting to complete 8 tasks from three studies. The studies included consumer banking websites, a mobile app for making purchases, and a findability task on the US Bank website that asked participants to find the name of the VP and General Counsel (an expected difficult task). Each task had a clear correct solution and “exploring” behavior wasn’t expected, thus minimizing possible confounds with natural browsing behavior that may look like lostness (e.g., looking at many pages repeatedly).
Sample sizes ranged from 5 to 16 for each task experience. We selected tasks that we hoped would provide a good range of lostness. For each task, we identified the minimum number of screens needed to complete each task for the lostness measure (R), and reviewed each video to count the total number of screens (S) and number of unique screens (N). We then computed the lostness score for each task experience. Post-task ease was collected using the SEQ and task time and completion rates were collected in the MUIQ platform.
Study Results
Across the 73 task experiences we had a good range of lostness, from a low of 0 (perfect navigation) to a high of .86 (very lost) and a mean lostness score of .34. We then aggregated the individual experiences by task.
Table 1 shows the lostness score, post-task ease, task time, and completion rate aggregated across the tasks, with lostness scores ranging from .16 to .72 (higher lostness scores mean more lostness).
| Task | Lostness | Ease | Time | Completion | % Lost |
|---|---|---|---|---|---|
| 1 | 0.16 | 6.44 | 196 | 100% | 6% |
| 2 | 0.26 | 6.94 | 30 | 94% | 19% |
| 4 | 0.33 | 6.00 | 272 | 40% | 40% |
| 3 | 0.34 | 6.19 | 83 | 100% | 44% |
| 6 | 0.37 | 4.60 | 255 | 80% | 60% |
| 7 | 0.51 | 4.40 | 193 | 100% | 40% |
| 8 | 0.66 | 2.20 | 339 | 60% | 100% |
| 5 | 0.72 | 2.40 | 384 | 60% | 100% |
Table 1: Lostness, ease (7-point SEQ scale), time (in seconds), completion rates, and % lost (> .5) for the eight tasks. Tasks sorted by lostness score, from least lost to most lost.
Using the Smith “lost” threshold of .5, we computed a binary metric of lost/not lost for each video and computed the average percent lost per task (far right column in Table 1).
Tasks 8 and 5 have both the highest lostness scores and percent being lost. All participants had lostness scores above .5 and were considered “lost.” In contrast, only 6% and 19% of participants were “lost” on tasks 1 and 2.
You can see a pattern between lostness and the ease, time, and completion rates in Table 1. As users get more lost (lostness goes up), the perception of ease goes down, time goes up. The correlations between lostness and these task-level measures are shown in Table 2 at both the task level and individual level.
| Metric | Task Level r | Individual Level r |
|---|---|---|
| Ease | -0.95* | -0.52* |
| Comp | -0.46 | -0.17 |
| Time | 0.72* | 0.51* |
Table 2: Correlations between lostness and ease, completion rates, and time at the task level (n = 8) and individual level (n = 73). * indicates statistically significant at the p < .05 level
As expected, correlations are higher at the task level as the individual variability is smoothed out through the aggregation, which helps reveal patterns. The correlation between ease and lostness is very high (r = -.95) at the task level and to a lesser extent at the individual level r = -.52. Interestingly, despite differing tasks, the correlation between lostness and task time is also high and significant at r = .72 and r = .51 at the task and individual levels.
The correlation with completion rate, while in the expected direction, is more modest and not statistically significant (see the “Comp” row in Table 2). This is likely a consequence of both the coarseness of this metric (binary) and a restriction in range with most tasks in our dataset having high completion rates.
The strong relation between perceived ease and lostness can be seen in the scatter plot in Figure 2, with users’ perception of the task ease accounting for a substantial ~90% of the variance in lostness. At least with our dataset, it appears that average lostness is well accounted for by ease. That is, participants generally rate high lostness tasks as difficult.
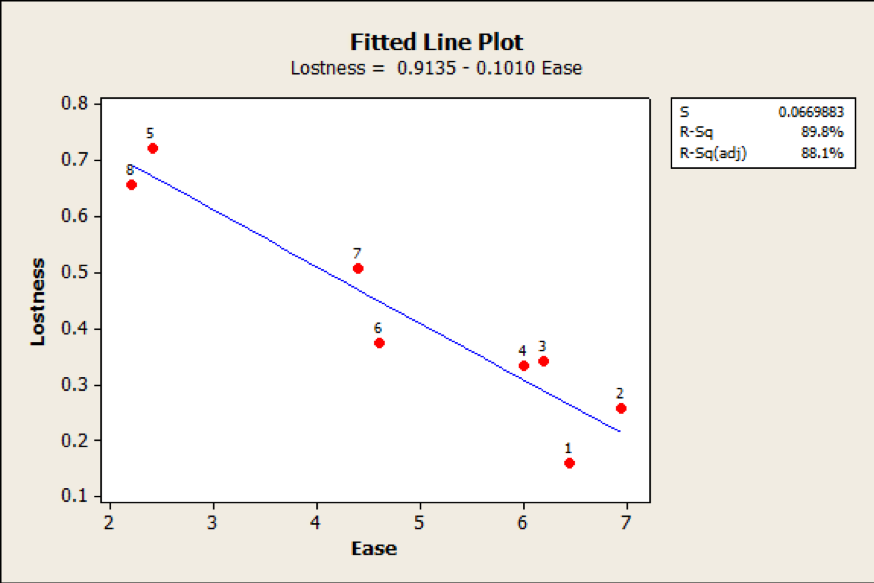
Figure 2: Relationship between lostness and ease (r = -.95) for the 8 tasks; p < .01. Dots represent the 8 tasks.
| Ease | N | % Lost | Mean Lostness |
|---|---|---|---|
| 1 | 6 | 1.00 | 0.73 |
| 2 | 4 | 1.00 | 0.72 |
| 3 | 4 | 1.00 | 0.62 |
| 4 | 3 | 0.00 | 0.17 |
| 5 | 3 | 0.33 | 0.26 |
| 6 | 13 | 0.31 | 0.35 |
| 7 | 40 | 0.23 | 0.24 |
Table 3: Percent of participants “lost” and mean lostness score for each point on the Single Ease Question (SEQ).
Further examining the relationship between perceived ease and lostness, Table 3 shows the average percent of participants that were marked as lost (scores above .5) and the mean lostness score for each point on the Single Ease Question (SEQ) scale. More than half the task experiences were rated 7 (the easiest task score), which corresponds to low lostness scores (below .4). SEQ scores at 4 and below all have high lostness scores (above .6), providing an additional point of concurrent validity for the lostness measure. Table 4 further shows an interesting relationship. The threshold when lostness scores go from not lost to lost happens around the historical SEQ average score of 5.5, again suggesting that below average ease is associated with lostness. It also reinforces the idea that the SEQ (a subjective score) is a good concurrent indicator of behavior (objective data).
| Lostness | N | Mean SEQ Score |
|---|---|---|
| 0 | 28 | 6.6 |
| 0.3 | 12 | 6.3 |
| 0.4 | 4 | 6.5 |
| 0.5 | 6 | 5.7 |
| 0.6 | 5 | 4.4 |
| 0.7 | 8 | 3.5 |
| 0.8 | 10 | 4.1 |
Table 4: Lostness scores aggregated into deciles with corresponding mean SEQ scores at each decile.
Validating the Lostness Thresholds
To see how well the thresholds identified by Smith predicted actual lostness, we reviewed the videos again and made a judgment as to whether the user was struggling or giving any indication of lostness (toggling back and forth, searching, revisiting pages). Of the 73 videos, two analysts independently reviewed 55 (75%) of the videos and made a binary decision whether the participant was lost or not lost (similar to the characterization described by Smith).
Lost Example: For example, one participant, when looking for the US Bank General Counsel, kept going back to the home page, scrolling to the bottom of the page multiple times, and using the search bar multiple times. This participant’s lostness score was .64 and was marked as “lost” by the evaluator.
Not Lost Example: In contrast, another participant, when looking for checking account fees, clicked a checking account tab, inputted their zip code, found the fees, and stopped the task. This participant’s lostness score was 0 (perfect) and was marked as “not lost” by the evaluator.
Table 5 shows the number of participants identified as lost by the evaluators corresponding to their lostness score grouped into deciles.
| Lostness Score | N | # Lost | % Lost |
|---|---|---|---|
| 0 | 28 | 1 | 4% |
| 0.3 | 6 | 2 | 33% |
| 0.4 | 1 | 1 | 100% |
| 0.5 | 3 | 1 | 33% |
| 0.6 | 4 | 4 | 100% |
| 0.7 | 5 | 5 | 100% |
| 0.8 | 8 | 6 | 75% |
Table 5: Percent of participants characterized as lost or not lost from evaluators watching the videos.
For example, of the 28 participant videos with a lostness score of 0, only 1 (4%) was considered lost. In contrast, 6 out of the 8 (75%) participants with lostness scores between .8 and .9 were considered lost. We do see good corroboration with the Smith thresholds. Only 9% (3 of 34) of participants with scores below .4 were considered lost. Similarly, 89% (16 of 18) participants were considered lost who had scores above .5.
Another way to look at the data, participants who were lost had a lostness score that was more than 5 times as high as those who weren’t lost (.61 vs .11; p <.01).
Summary and Takeaways
An examination of a method for measuring lostness revealed:
Lostness as path taken relative to the happy path. An objective lostness measure was proposed over 20 years ago that uses the sum of two ratios: the number of unique pages relative to the minimum number of pages, and the total number of pages relative to the unique number of pages. Computing this lostness measure requires identifying the minimum number of pages or steps needed to complete a task (the happy path) as well as counting all screens and the number of unique screens (a time-consuming process). A score of 0 represents perfectly efficient navigation (not lost) while a score of 1 indicates being very lost.
Thresholds are supported but not meant for task failure. Data from the original validation study had suggested lostness values below .4 indicated that participants weren’t lost and values above .5 as participants being lost. Our data corroborated these thresholds as 91% of participants with scores below .4 were not considered lost and 89% of participants with scores above .5 were lost. The thresholds and score, however, become less meaningful when a user fails or abandons a task and visits only a subset of the essential screens, which decreases their lostness score. This suggests lostness may be best as a secondary measure to other usability metrics, notably task completion.
Perceived ease explains lostness. In our data, we found that average task-ease scores (participant ratings on the 7-point SEQ) explained 95% of the variance in lostness scores. At least with our data, in general, when participants were lost, they knew it and rated the task harder (at least when aggregated across tasks). While subjective measures aren’t a substitute for objective measures, they do correlate, and post-task ease is quick to ask and analyze. Lower SEQ scores already indicate a need to look further for the problems and this data suggests participants getting lost may be a culprit for some tasks.
Time-consuming process is ideally automated. To collect the data for this validation study we had to review participant videos several times to compute the lostness score (counting screens and unique screens). It may not be worth the effort to review videos just to identify a lostness score (especially if you’re able to more quickly identify the problems users are having with a different measure). However, a lostness score can be computed using software (something we are including in our MUIQ platform). Researchers will still need to input the minimal number of steps (i.e., the happy path) per task but this measure, like other measures such as clicking non-clickable elements, may help quickly diagnose problem spots.
There’s a distinction between browsing and being lost. The tasks used in our replication study all had specific answers (e.g. finding a checking account’s fees). These are not the sort of tasks participants likely want to spend any more time (or steps) on than they need to. For these “productivity” tasks where users know exactly what they need to do or find, lostness may be a good measure (especially if it’s automatically collected). However, for more exploratory tasks where only a category is defined and not a specific item, like browsing for clothing, electronics, or the next book to purchase, the natural back-and-forth of browsing behavior may quantitatively look like lostness. A future study can examine how well lostness holds up under these more exploratory tasks.