 In an earlier article, we reviewed five competing models of delight.
The models differed in their details, but most shared the general idea that delight is composed of an unexpected positive experience. Or, for the most part, delight is a pleasant surprise.
However, there is disagreement on whether you actually need surprise to be delighted. And if you don’t need surprise, then delight is really just an extreme form of satisfaction.
With the disagreement on how to define delight, there consequently is no agreement on exactly how to measure delight. But that shouldn’t be too much of a surprise. We encountered the same issue with satisfaction measures. Despite satisfaction being a seemingly well understood (and older) construct, we still found five common ways satisfaction is measured in the literature.
So even if researchers coalesce around a common definition of delight, don’t expect there to be a universally accepted single delight measure.
While academics love to argue about the “right” model, pragmatically, researchers want to know how to measure (and improve) things.
In this article we’ll review many ways researchers have attempted to measure delight in the published literature. In an upcoming article, we’ll more closely examine which ones may be best at capturing delight and whether it’s even worth measuring at all.
The three most common ways of measuring delight use single items, two+ items, and a mix of feelings, but we’ll review some less common measurement methods as well. You’ll see that there are more ways of measuring delight than there are models of delight!
1. Single-Item Measures
One common approach to measuring delight is to simply ask participants how delighted they were with an experience.
One of the first measures was used by Westbrook in 1980. He used a single seven-point scale (shown below), anchored by Delighted and Terrible, that he found was correlated with intention.
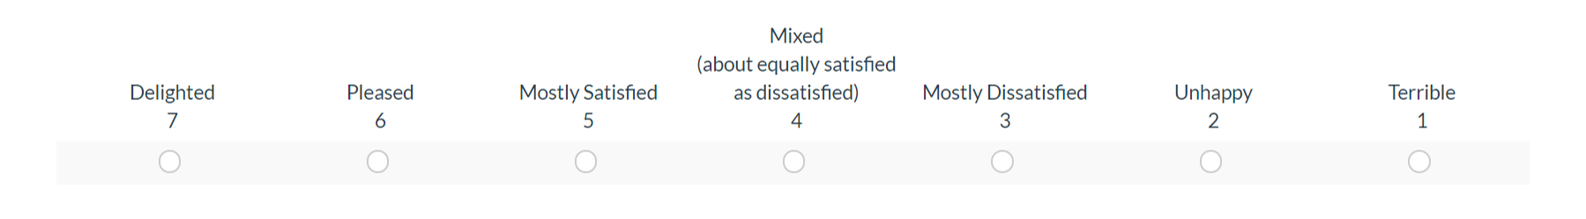
In his study, participants were asked how they felt about an experience. The scale was later used by Oliver et al. (1997) in their foundational paper on delight (in addition to other scales discussed below).
More recently, JD Power described a Net Delighted (ND) score, another single-item scale. Participants were asked to reflect on a service experience on a ten-point satisfaction scale, with 10 being “outstanding” and 1 to 5 being “displeased” (the scale anchors were not provided). The “Net” score was derived by subtracted the displeased from the outstanding (10 minus the 1 to 5s).
Using a single item with the resulting high scores does seem very similar to an extreme form of satisfaction. And if delight can be considered as a higher level of satisfaction without surprise, then it’s likely these single items would be adequate. However, not all researchers agree that a single item is adequate to capture delight.
2. Two+ Scales
Most of the models of delight we reviewed describe two aspects of delight: surprise and joy/pleasantness.
Consequently, an alternative (and arguably more popular way) to measure delight is to ask at least two questions that explore the multiple underlying emotions.
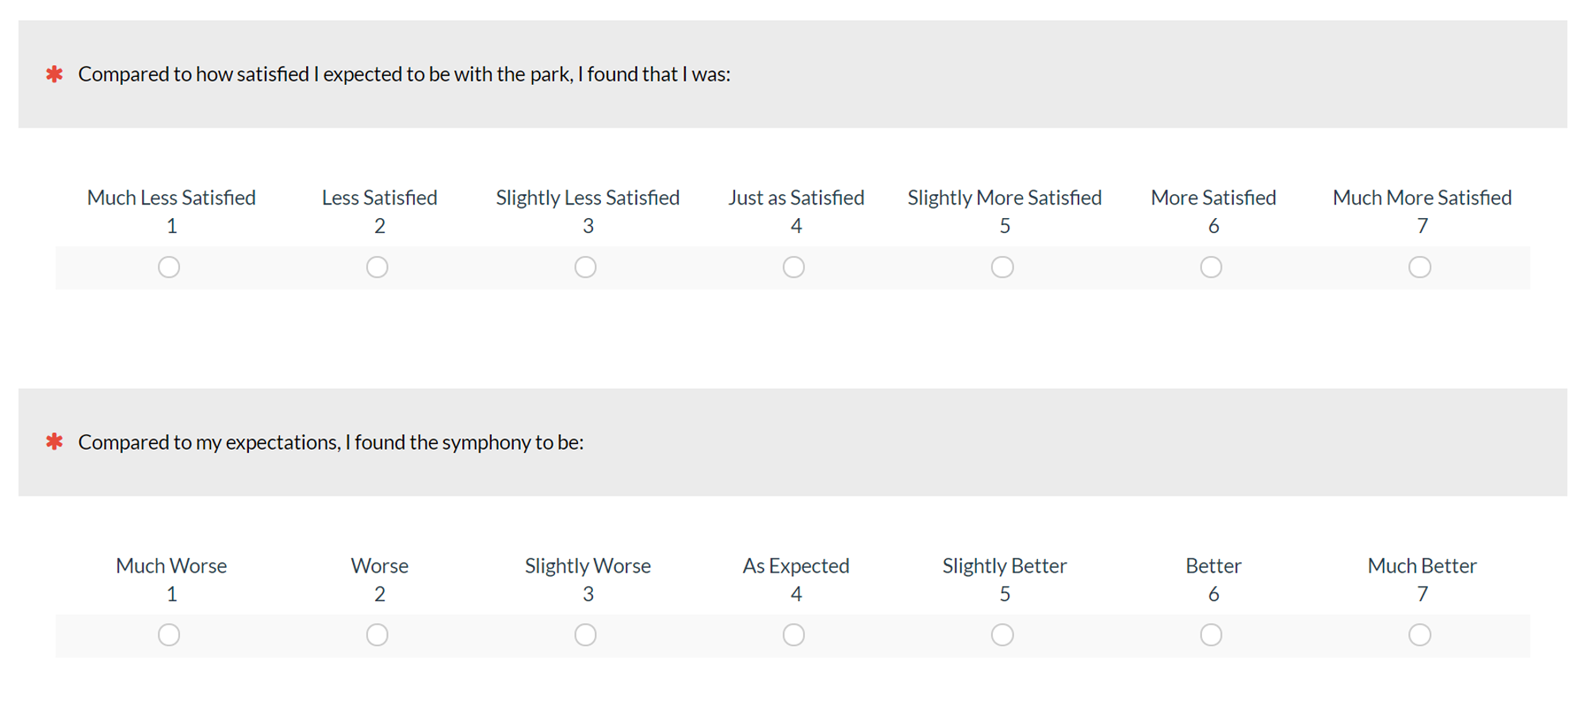
In the Oliver (1997) study, they also used a seven-point satisfaction scale and seven-point performance scale (as shown below). They then computed delight as a top-box from both scales. These same scales (shown below) were also used in a later study by Vanhamme (2003).
In another example, Loureiro (2010) measured delight by having respondents (rural tourists) rate their agreement to two items on a five-point scale (1 = strongly disagree, 5 = strongly agree). They used the mean, rather than top-box scores.
Ngobo (1999) considered delight as equivalent to 100% satisfaction and used responses to the following four seven-point agreement/Likert items (the anchors also weren’t fully described in his study):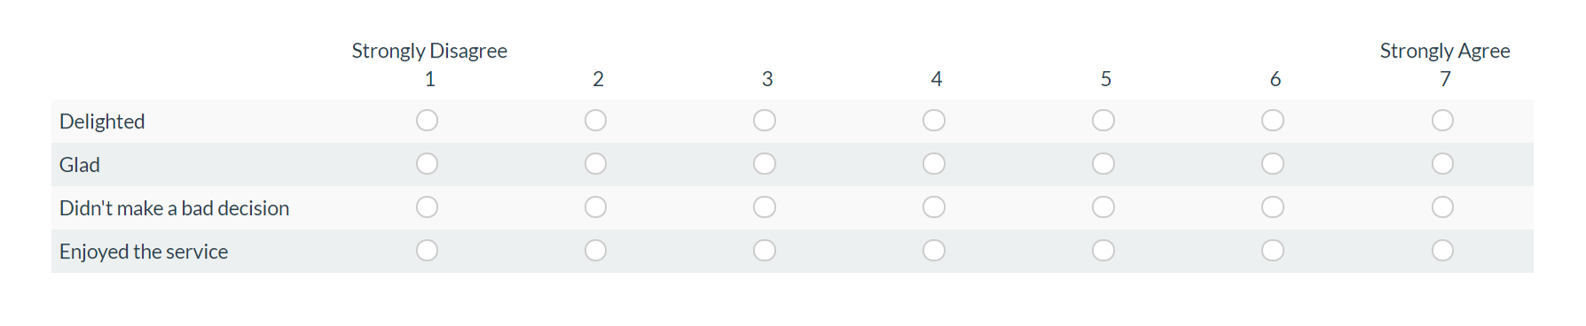
3. Adjective Lists
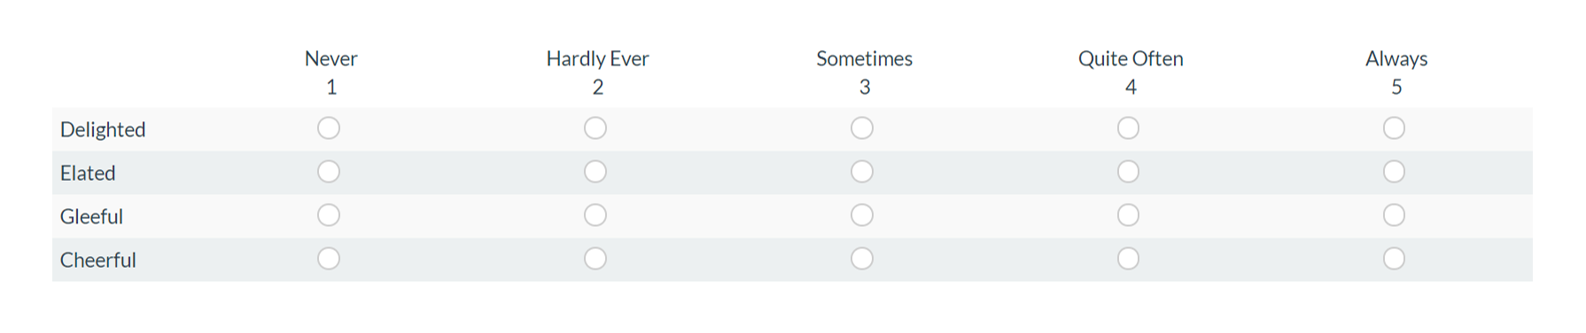
Another approach using multiple items found in the literature is having participants respond to several adjectives that describe the overlapping emotions associated with delight. This is something similar to the Microsoft Reaction Cards. For example, Oliver et al. (1997) used 13 adjectives (adapted from Larsen and Diener, 1992), including the three below, and had participants rate how frequently they felt these emotions.

In a study by Ball and Barnes (2017), they used four adjectives with the same frequency scale from Never to Always (about a Bruce Springsteen rock concert):
They averaged across the item responses to get their measure of delight.
Website Delight
In one of the rare cases where delight was measured using adjective lists outside the hospitality industry, Finn (2005) had participants rate how frequently they felt the following 13 emotions taken from Oliver (1997), also from Never to Always, on a website experience (e.g., Amazon, eBay, Ticketmaster). 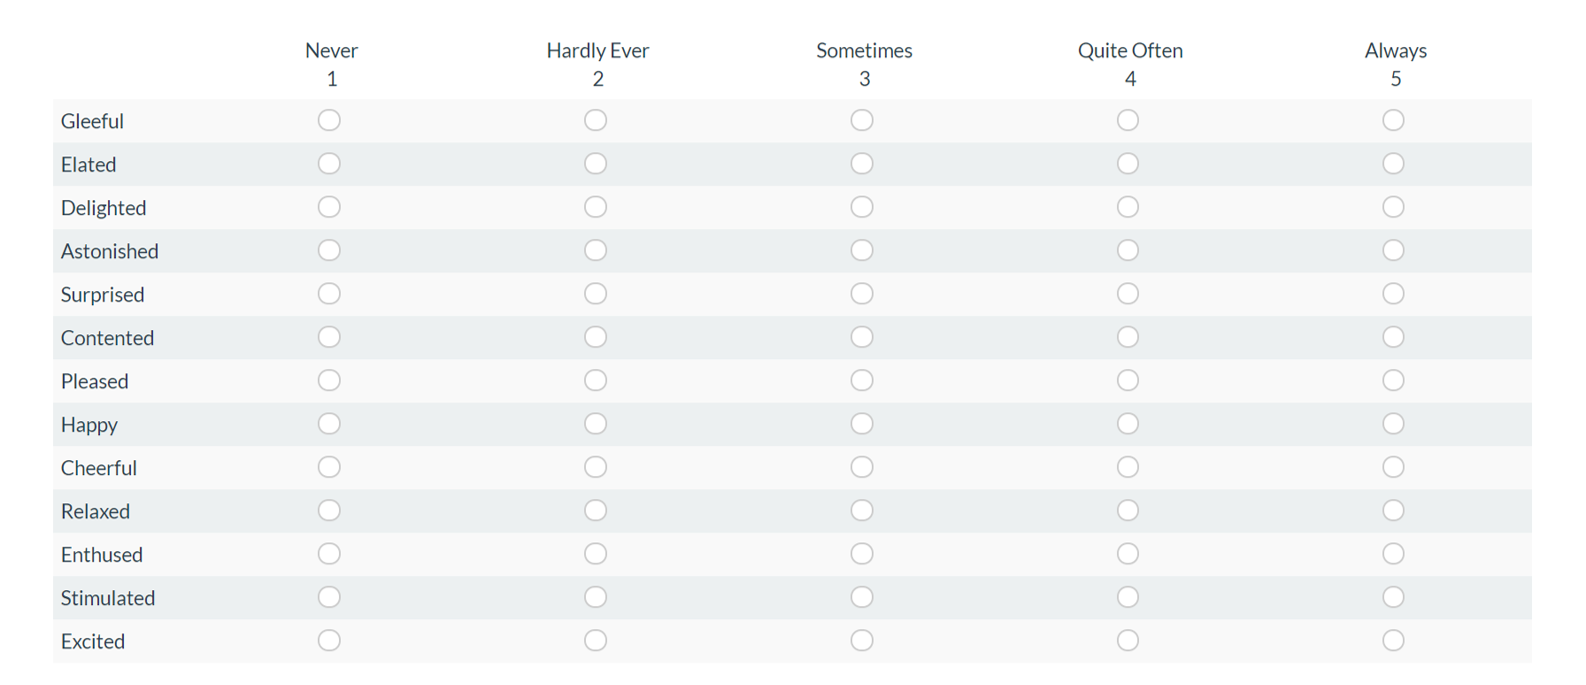
While it would seem that just asking about delight would be adequate, Finn found that the “delight” adjective (along with happy and excited) cross-loaded on two factors that made it more problematic to statistically model. Cross-loading may suggest that the term delight isn’t a well-formed single concept in the minds of participants; this is something future research can examine more.
Diary Study Delight
Most of the studies described in the literature rely on surveys often collected well after an event or occurrence. One concern with this approach is that too much time has passed since the event (a non-contemporaneous account) for people to accurately reflect on their emotional reaction.
In an interesting multi-part study by Vanhamme (2003), she had her participants fill out a diary (a technique popular with UX researchers). Participants wrote down their purchases over seven nights and whether it was consumed (consumption/purchase) and whether they were surprised.
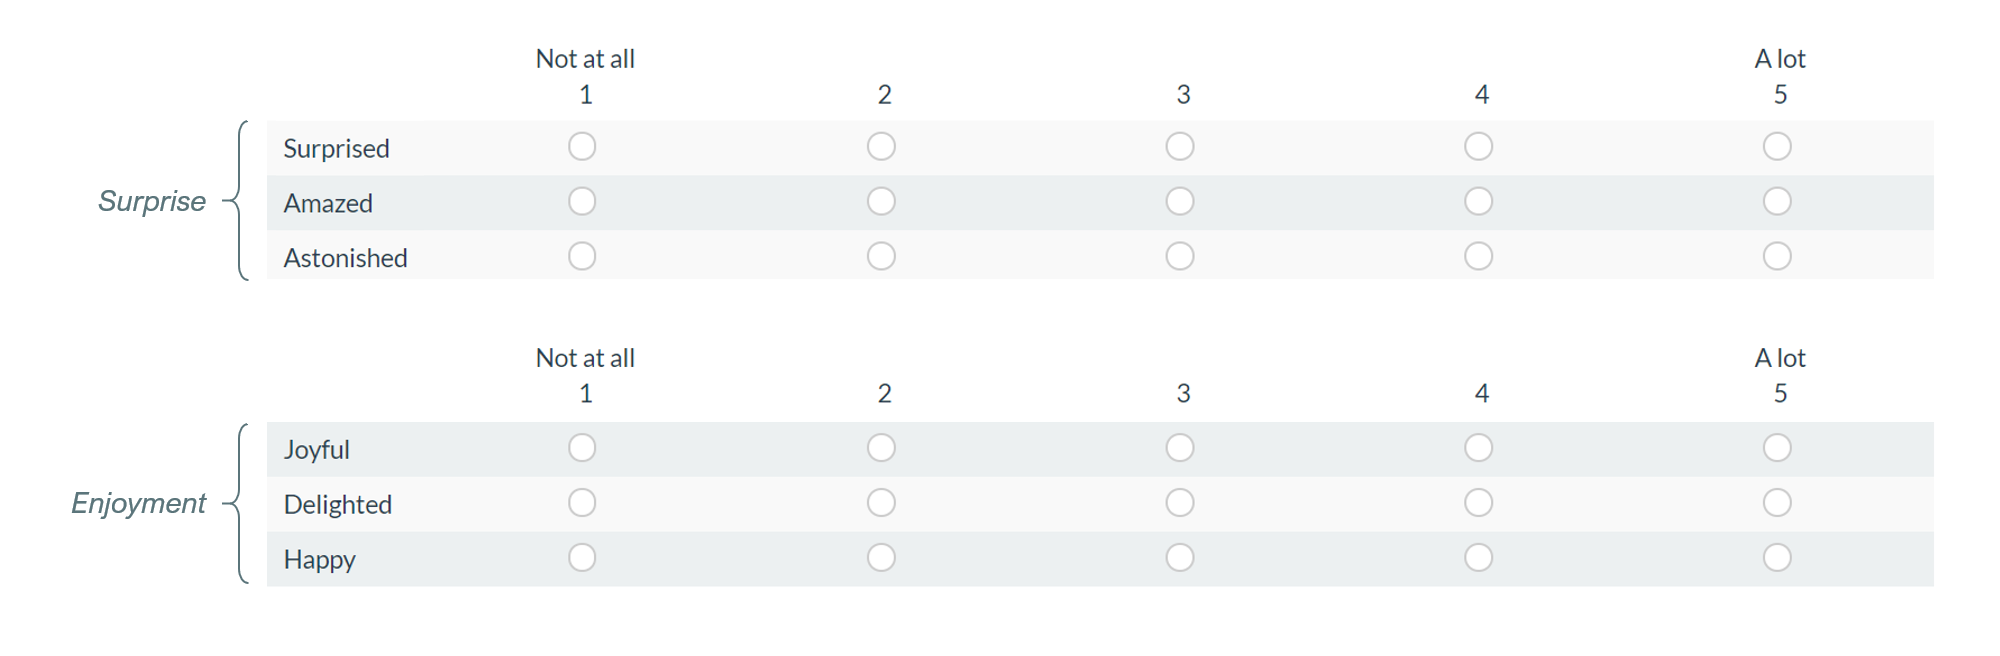
Vanhamme then used a variation of the Differential Emotional Scale (DES) to have participants reflect on their experience. The DES is described in Izard (1977) and has multiple items for seven constructs, including both positive (Surprise and Enjoyment) and negative (Anger, Fear, Disgust, Contempt, and Disdain) attitudes.
The six adjectives associated with two of the constructs (surprise and enjoyment) were used as the measure of delight in her study. The adjectives are anchored from 1 = Not at all to 5 = A lot.
4. Kano Questions
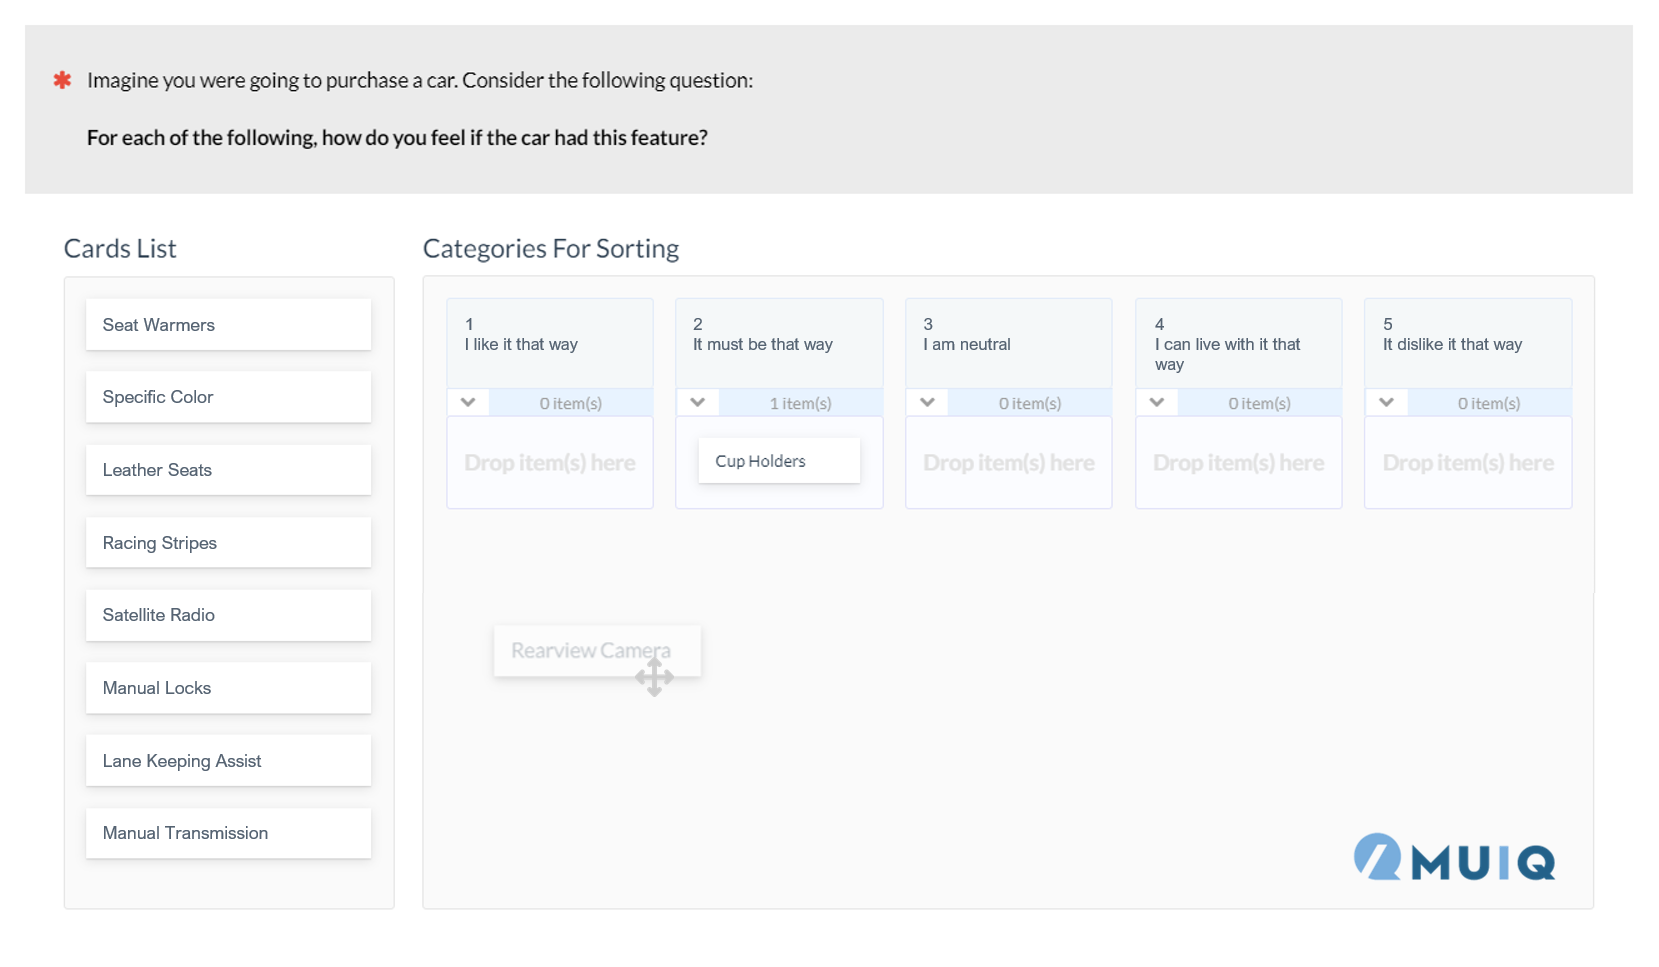
The Kano can be seen as a special case of the two+ item format. It’s familiar to UX researchers and has its own (somewhat peculiar) way to get at delight. Whereas a lot of the literature on delight is measured in the context of a service experience (amusement park, concert, food consumption, hotel stays), the Kano is suited particularly well for feature identification.
For the Kano, participants are asked to answer two questions. The first is called the functional question: What are your feelings when the feature is included? The second is called the dysfunctional question: What are your feelings when this feature is NOT included?
If a respondent to the functional question picks “I like it that way” and responds to the dysfunctional question with “I can live with it that way,” the feature is a delighter.
We’ve found that a good way to administer the Kano and minimize potential participant fatigue is to use a card-sort type option such as the one below from our MUIQ platform. We also provide an example of how to categorize features before presenting these options.
5. Text Analysis
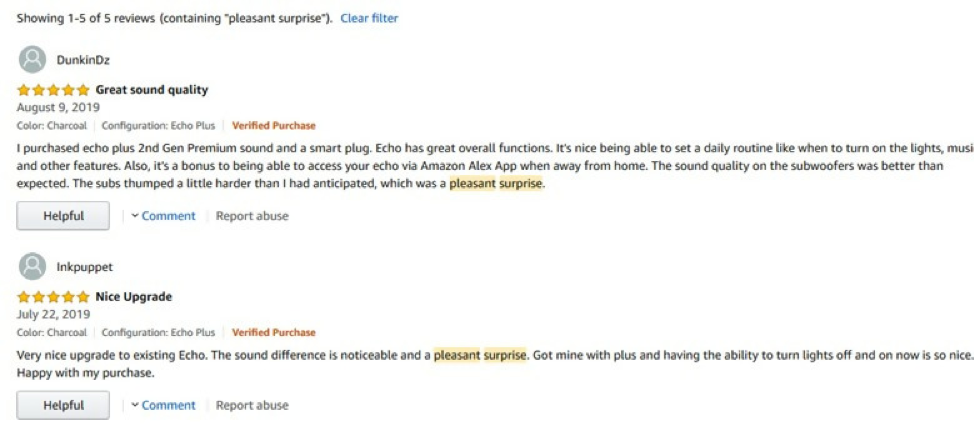
All the prior examples of measuring delight rely on a closed-ended type of rating scale. A study by Magnini et al. (2011) used open-ended responses instead. They analyzed the content of 743 travel blogs for phrases such as “pleasant surprise,” “delightful surprise,” or “excellent surprise.”
It’s unclear how effective this approach is as it hasn’t been written about widely in the literature (that I could find). It would be difficult to gauge reliability, for example. However, if an organization has access to product or service reviews (even public facing ones), this may be a quick way of both gauging delight and understanding the context in which the delight was experienced. For example, I did a search for “pleasant surprise” on the reviews of Amazon’s Echo product and found 5 responses (out of over 5,000 reviews!) exemplifying this definition of delight:
6. Objective Measures of Delight
The previous examples of measuring delight relied on self-reports, either in surveys, contemporaneous diary studies, or in service or product reviews. There are at least three potential problems with self-reported data:
Rationalizing: People may be just rationalizing their emotions with their actions.
Social Acceptance: Participants may not want to share their emotions with strangers or in surveys (especially if it’s associated with their identity).
Inaccessibility: Participants may not always be able to identify their emotional state (because they lack abilities of introspection and retrospection).
While delight can be thought of as a subjective experience (not all people consider the same things delightful), there have been attempts to measure delight objectively, possibly avoiding the potential problems with self-reported data, including:
- GSR: Galvanic skin response is a measure of essentially how much people sweat (similar to a lie detector).
- EMG: Muscle movements are measured using an electromyogram (EMG).
- Facial expressions: Participant facial expressions are videotaped and coded independently by three judges, by measuring eyebrow raising, eye widening, mouth opening. (See Reisenzein, 2000.)
However, the study by Reisenzein found that GSR and EMG measures were both difficult to collect (people needed to hold still) and didn’t correlate with other subjective measures. In his study, he had better luck with coding facial expressions and correlating those with other subjective measures (and avoided hooking participants up to all that equipment, reminiscent of something from A Clockwork Orange!).
Consequently, Vanhamme’s 2003 paper (the same one we cited earlier) used facial expressions to gauge surprise. In her third study, participants consumed strawberry yogurt with a foldable spoon (which was meant to elicit surprise) or without one. The facial expressions correlated modestly with other subjective measures. If these can be collected automatically (with software), these may be one way to gauge surprise or joy, although it’s likely this would still need to be coupled with a subjective measure to gauge delight.
Summary and Discussion
A review of the literature on how to measure delight revealed:
There isn’t a single measure of delight. If you hear people talking about measuring delight, ask which model they’re using and certainly which measures they’re using. Our review of the literature uncovered at least ten different scales and multiple methods of collection. In most studies, multiple measures were used (often a combination of 2+ rating scales and adjective frequency lists).
Multi-item subjective measures dominate, but single items may be adequate. Our review of the published literature revealed that most studies use multi-item measures of delight, but if surprise isn’t necessary to have delight (an open question) then it’s likely single item measures (e.g., Terrible to Delightful) may be adequate. It also may mean that delight may not be distinct from some form of extreme satisfaction. Whether any delight measures offer better predictive validity (of retention or usage) is a subject for future research (and a future article).
There are multiple methods of data collection. Surveys of one point in time tend to be the dominant method for collecting delight measures. Other methods include more contemporaneous diary studies, analyzing text in product reviews, and observing facial expressions.
Some objective measures may work. Some researchers have found that coding facial expressions shows promise for measuring surprise and/or joy. Attempts at using Galvanic Skin Response and muscle movements (EMG) have been impractical and they didn’t corroborate with other subjective measures. It’s unclear though whether facial expressions alone can measure delight (or just surprise or joy) and whether these really are superior to self-reports of data (they certainly require more involvement).
Correlation with objective measures increase credibility of subjective measures. Interestingly, the finding that facial expression coding correlated at least modestly in some studies (e.g., r ~ .3) with some subjective measures of delight provides additional validation for subjective measures. Coding facial expressions may be impractical (too costly or time consuming), but their correlation suggests researchers can place more trust in these easy-to-collect subjective measures. How delightful.